Chainlink (LINK/USDT) Struggles to Maintain Upside Trajectory
Estimated Reading Time: 3 minutes
Don’t invest unless you’re prepared to lose all the money you invest. This is a high-risk investment and you are unlikely to be protected if something goes wrong. Take 2 minutes to learn more

Chainlink Long-term Analysis: Ranging
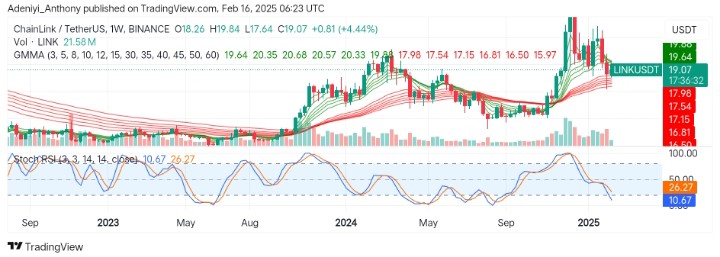
The market for Chainlink against the Tether after the recent dip in price has been oscillating within a tight range. This can be noticed in the contraction of the Guppy Multiple Moving Averages (GMMAs), as both sets of EMAs converge together despite the recent 4.44% gain for the week.
Recently, LINK/USDT has shown bullish momentum in the past with a prolonged pullback. However, current retracements indicate difficulty sustaining an uptrend due to reduced market participation.
Currently, Chainlink trades at $19.07, a historical peak in the past with just 21.58 million traded volumes for the week.
Technical Indicators
Major Resistance Levels: $19.88, $20.68, and $21.58
Major Support Levels: $17.15, $16.50, and $15.97
Chainlink Technical Analysis
On the weekly timeframe, Chainlink against the Tether has witnessed difficulty in maintaining an upside momentum, which can be attributed to a weakened pressure and closeness to an upper limit.
The GMMAs on one side suggest bearish pressure as the short-period EMAs slope downward while the long-period EMAs flatten out, suggesting a loss of strong bullish momentum.
On the other hand, the Stochastic RSI at the bottom of the chart suggests a potential bounce in the near term as the lines extend into the extreme oversold region.
To this end, the price needs to hold above $19.88 to continue a bullish trajectory; otherwise, a reduction in bullish participation around the immediate upper limit may push the price toward the $17.15 support level.
LINK/USDT Analysis: Where from Here?
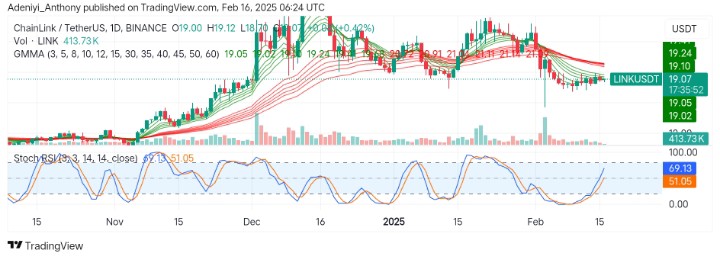
On the daily timeframe, LINK/USDT is slightly showing a sign of recovery with short-period EMAs converging towards the long-period EMAs. However, with the resistance at $19.24, the potential bullish crossover may be delayed slightly.
On the other hand, the Stochastic RSI indicates the pair has more room for improvement to the north as the highest value of the lines lies below the 70-mark level. This suggests bullish momentum is growing, but the potential overbought ahead could lead to a minor pullback.
To this end, bullish participation needs to increase for a break above $19.24 to maintain a trajectory toward $21.14; otherwise, the price may continue oscillating at this level.
You can purchase crypto coins here. Buy LBlock