Dogecoin (DOGE) Price Prediction: DOGE/USDT Maintains Support Above $0.14500 Price Level
Estimated Reading Time: 3 minutes
Don’t invest unless you’re prepared to lose all the money you invest. This is a high-risk investment and you are unlikely to be protected if something goes wrong. Take 2 minutes to learn more

Dogecoin (DOGE) Price Prediction for November 4
In the Dogecoin market, the $0.1800 price level has formed a strong resistance to price movement. As a result, the market has been on a steady downward retracement for the past six sessions. This points to the fact that downward forces are in cruise control at the moment.
DOGE/USDT Long-term Trend: Bearish (Daily Chart)
Key Price Levels:
Resistance: $0.3500, $0.4000, $0.4500
Support: $0.3000, $0.2500, $0.2000
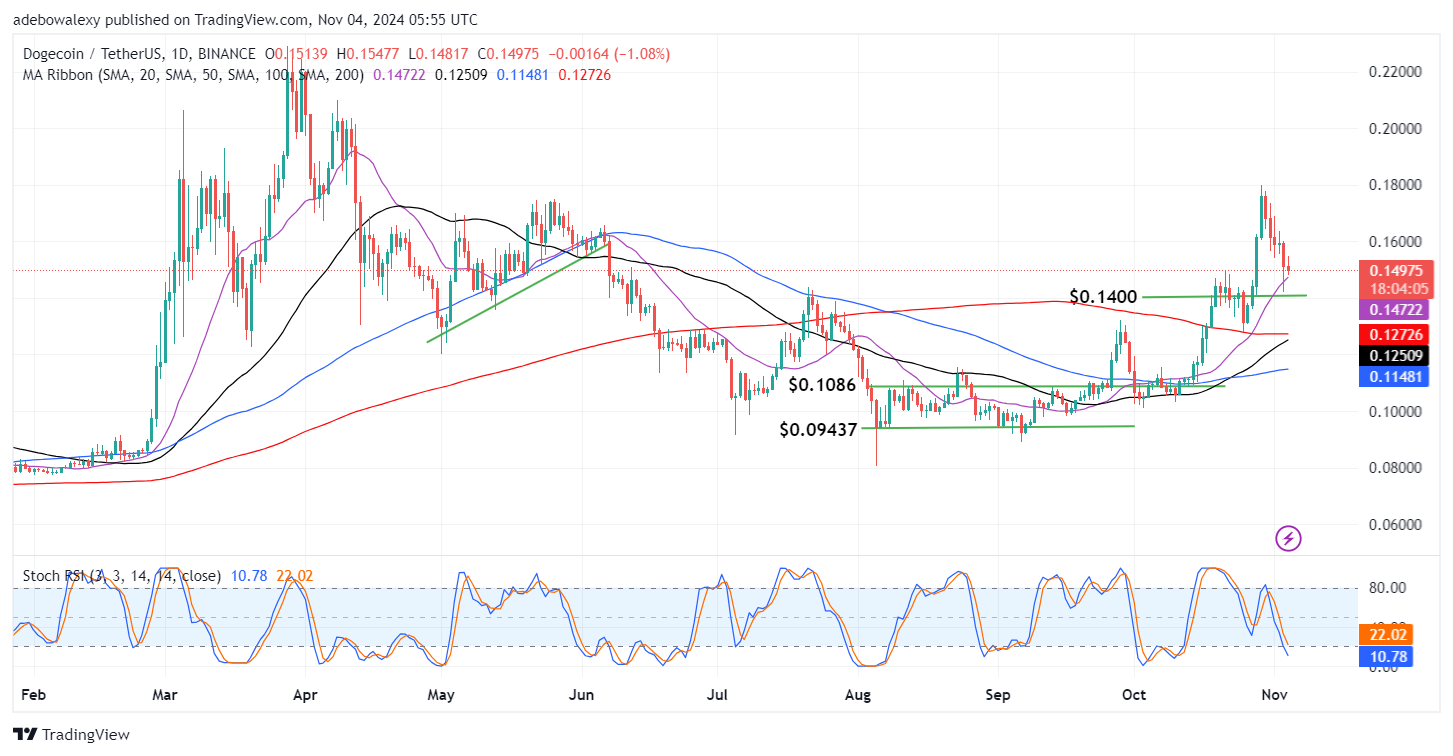
Despite the upward contraction that occurred in the previous session in the Dogecoin daily market, price action remains oriented toward lower price levels. The last price candle here remains bearish in appearance. Through it, the market stands just above the 20-day MA curve. Price action stays above all the Moving Average (MA) lines. Nevertheless, the Stochastic Relative Strength Index lines are still falling into the oversold region, with no hint of a trend reversal through an upside crossover.
Dogecoin (DOGE) Price Prediction: DOGE/USDT May Break Nearby Support
Currently, price activity in the Dogecoin daily market lies above all the MA lines but appears oriented towards breaking this support. Since the past six sessions now, price activity has been considerably bearish, going by the number of sessions through which downward forces have been dominant in this market.
Also, the Stochastic RSI lines have continued to descend lower into the oversold region. Even despite the moderate upward contraction that occurred in the previous session, the lines of this indicator aren’t reflecting it through a deflection. Consequently, price activity seems geared toward further price decline.
Dogecoin (DOGE) Price Prediction: DOGE/USDT Set to Resume Downward Retracement (4-Hour Chart)
The last price candle in the Dogecoin 4-hour chart has also appeared bearish. This price candle can be seen standing just above the 100-day MA line. Meanwhile, the 20- and 100-day MA curves can be seen delivering a bearish crossover above price activity. This hints that downward forces may gain renewed momentum. The Stochastic RSI indicator lines can be seen to be rising upward but currently have a deflection in their leading line.
Going by indications, the direction of price action seems consistently aligned towards a continued price reduction, from the daily chart to the 4-hour price chart. The activity of the Stochastic RSI indicator lines can be seen as having a deflection already, while the ongoing session has appeared bearish. Therefore, traders can target the $0.1400 price level.