Dogecoin (DOGE) Price Prediction: DOGE/USDT Rebounds Above the $0.1700 Mark
Estimated Reading Time: 3 minutes
Don’t invest unless you’re prepared to lose all the money you invest. This is a high-risk investment and you are unlikely to be protected if something goes wrong. Take 2 minutes to learn more

Dogecoin Price Prediction Date: May 5, 2025
The Dogecoin market has maintained its position above the $0.1500 price level and recently moved past the $0.1700 mark. The price candle corresponding to the current session can be positioned just above a key technical level.
DOGE/USDT Long-Term Trend: Bullish (Daily Chart)
Key Price Levels:
Resistance: $0.2500, $0.3000, $0.3500
Support: $0.2000, $0.1500, $0.1000
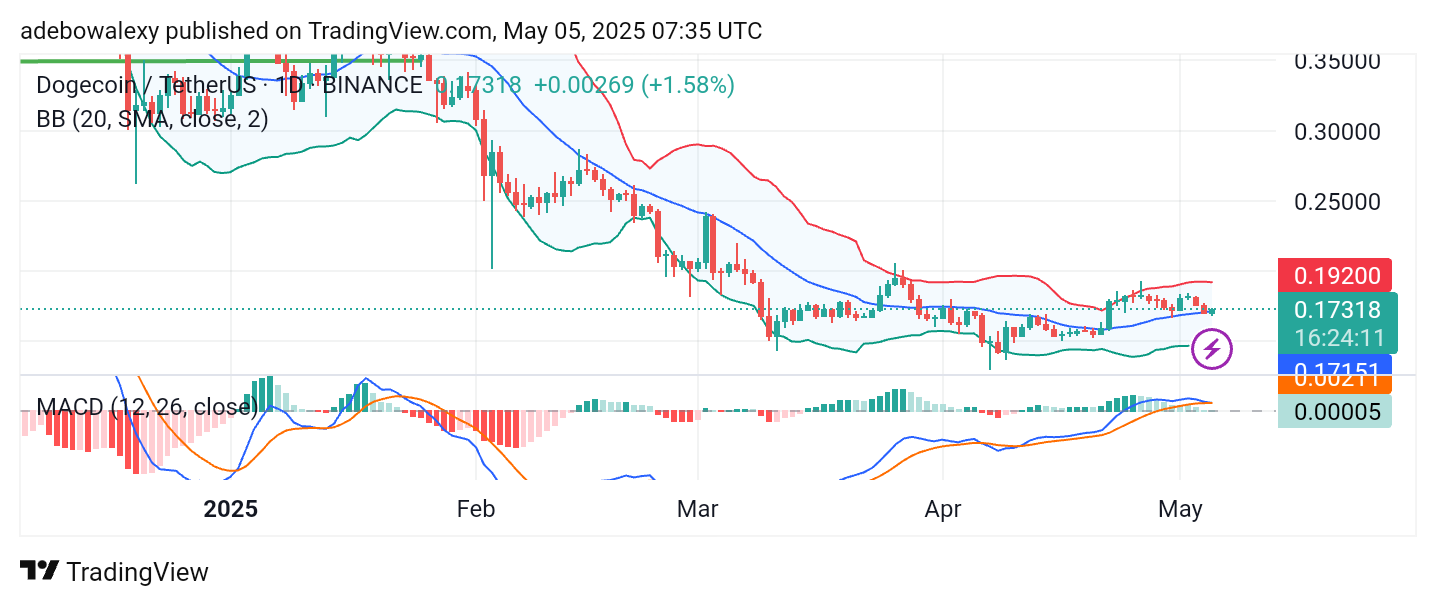
The Dogecoin market has experienced a steady decline over the past two sessions, causing price action to retrace toward the middle band of the Bollinger Bands indicator. However, the current session has shown a modest upward rebound, keeping the market slightly above the middle band. The Moving Average Convergence Divergence (MACD) indicator lines are converging above the equilibrium level and are on the verge of forming a bearish crossover.
Dogecoin (DOGE) Price Prediction: Support at the Middle Band of the Bollinger Indicator Holds in the DOGE/USDT Market
Price activity in the Dogecoin daily chart was temporarily deflected from its modest upward trajectory. However, as soon as the price tested support at the middle band of the Bollinger Bands, it rebounded upward—albeit with limited momentum.
Nonetheless, this rebound has kept price action above the middle band. Meanwhile, the MACD lines remain above the equilibrium level, although they have converged. This implies a potential for the price to rebound upward. Additionally, the MACD histogram bars remain above the equilibrium level, which still offers some positive sentiment for the market.
Dogecoin (DOGE) Price Prediction: DOGE/USDT Upward Bounce May Strengthen
Examining the Dogecoin market on the 4-hour chart, price action has shown a moderate rebound. The latest price candle is green, following a series of small red candles. This bounce emerged from the lower band of the Bollinger Bands indicator.
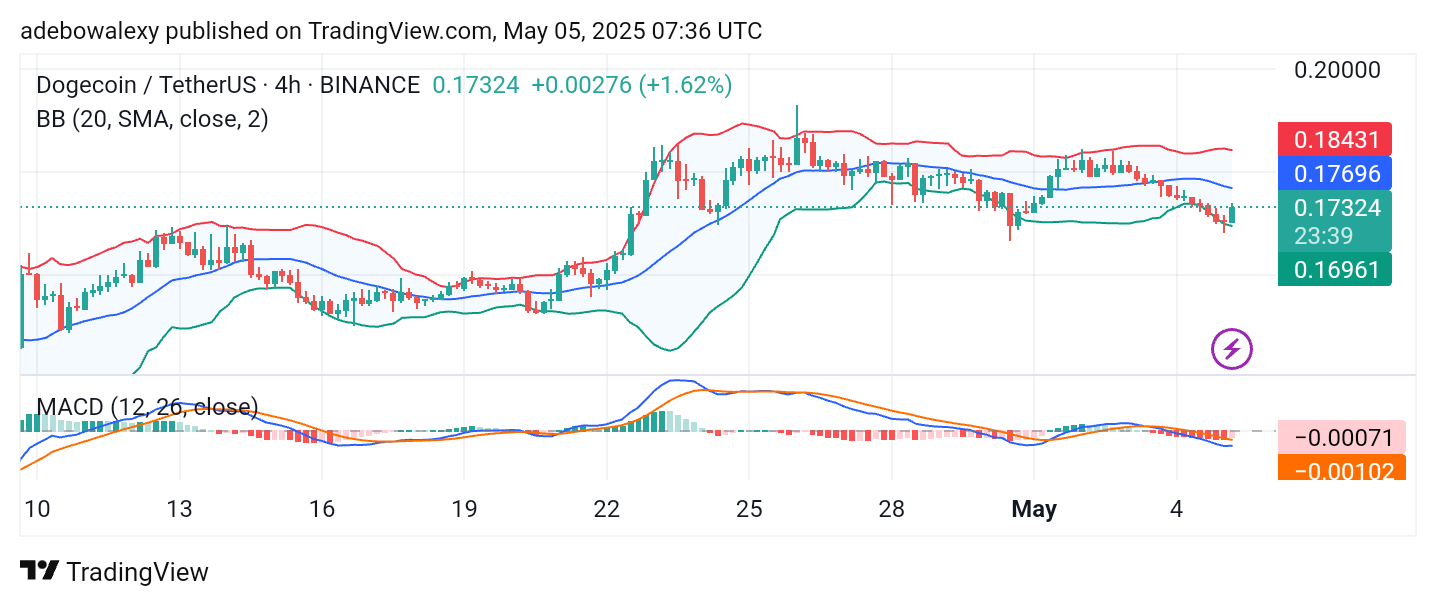
Simultaneously, the MACD lines are below the equilibrium level but are moving sideways, accompanied by a pale red histogram bar. The appearance of this pale red bar suggests that downward pressure is weakening, and bullish forces may push the market toward the $0.1800 price level initially, with potential for further gains.