Dogecoin (DOGE) Price Prediction: DOGE/USDT Tests a Key Base Level
Estimated Reading Time: 3 minutes
Don’t invest unless you’re prepared to lose all the money you invest. This is a high-risk investment and you are unlikely to be protected if something goes wrong. Take 2 minutes to learn more

Date: August 25, 2025
The Dogecoin market previously leaned toward a downward retracement but soon edged higher during the past week. However, a downward retracement can be seen to have started two sessions ago and has continued till now. Also, as modest as it is, price action can be seen to have descended past a key base level which hints that further lower levels may be visited.
DOGE/USDT Long-Term Trend — Bearish (Daily Chart)
Key Price Levels:
Resistance: $0.2500, $0.2750, $0.3000
Support: $0.2200, $0.1950, $0.1700
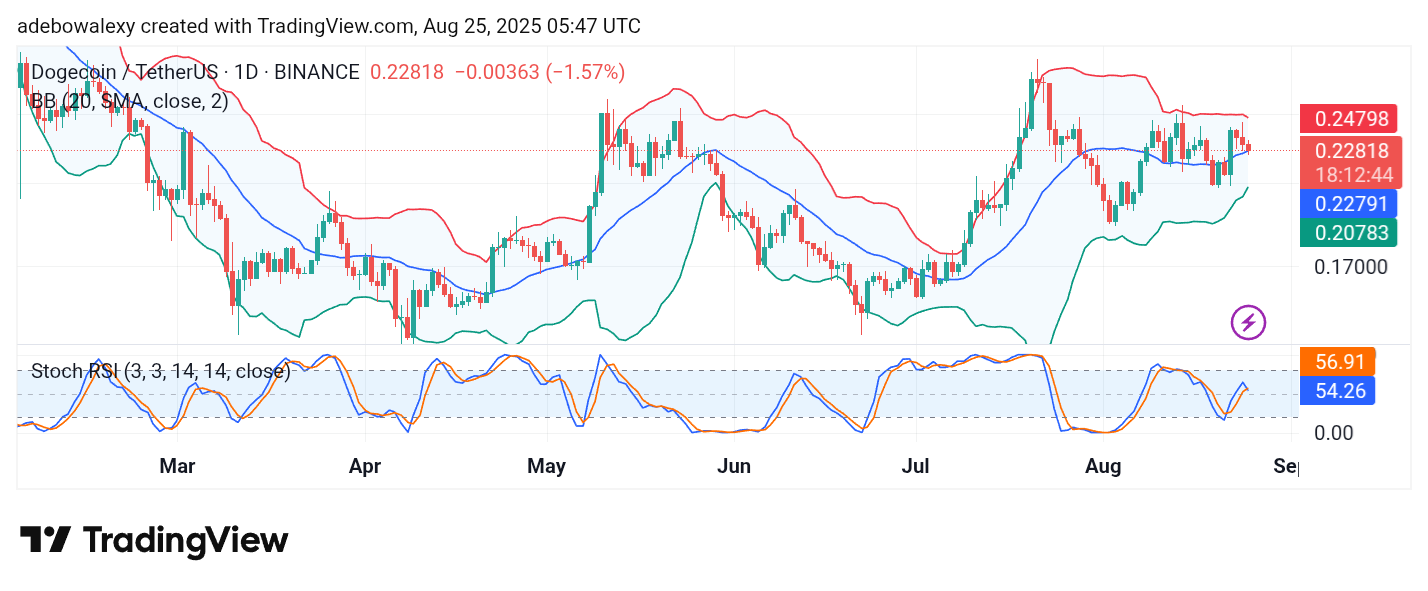
Dogecoin has rebounded downward as mentioned earlier two sessions ago. The ongoing session, which is the third session, has stayed the course as it tests the middle band of the Bollinger Bands BB indicator. Meanwhile, the Stochastic Relative Strength Index SRSI indicator lines are now converging for a downward crossover just above the 50 threshold of the indicator. Be that as it may, the BB indicator retains an upward tilt.
Dogecoin (DOGE) Price Prediction: DOGE/USDT Market Is at a Crossroad
As noted, the Dogecoin daily market currently stands at a key base level. The last price candle on this chart stands directly upon the middle band of the BB indicator.
By inspection, it can be seen that bearish momentum stays almost constant going by the appearance of the last three price candles on this chart. Nevertheless, the Bollinger Bands BB indicator retains a slight upward tilt at the terminal.
The lines of the SRSI indicator are now converged to initiate a bearish crossover. Technically, this hints that price action may breach the support offered by the middle band of the BB indicator.
Dogecoin (DOGE) Price Prediction: DOGE/USDT Passes a Short-Term Bearish Test (4-Hour Chart)
Coming to the Dogecoin market of 4-hours, it can be seen that price action has fallen below the middle band of the applied BB indicator. Also, the mentioned price candle here suggests that downward forces are threatening steeper falls.
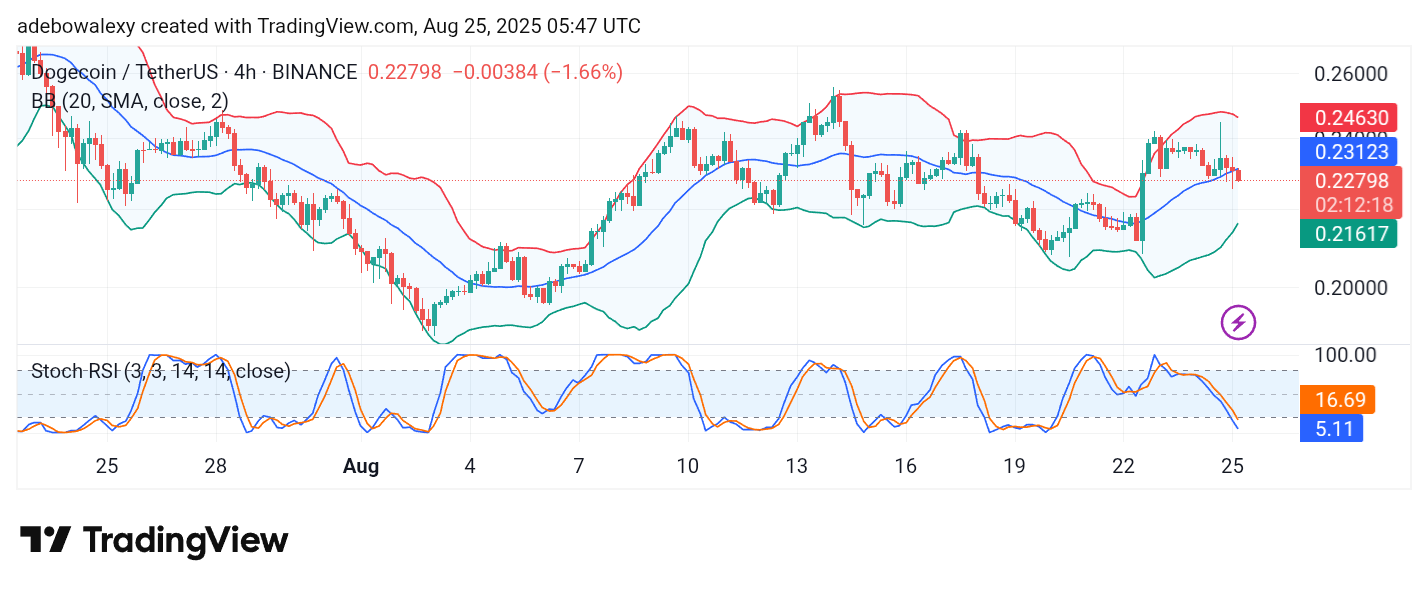
But interestingly, the BB indicator retains its upward trajectory. Likewise, the extreme bands of the indicator are contracting. Meanwhile, the lines of the SRSI indicator continue a smooth descent into the oversold zone of the indicator. With the SRSI lines almost at the 0.00 level, price action may proceed towards the $0.2200 or $0.2150 price level in the short term.