HyperLiquid (HYPE/USDT) at a Critical Point: Where from Here?
Estimated Reading Time: 3 minutes
Don’t invest unless you’re prepared to lose all the money you invest. This is a high-risk investment and you are unlikely to be protected if something goes wrong. Take 2 minutes to learn more

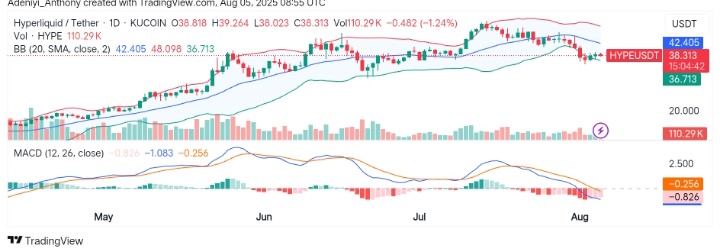
The market for Hyperliquid against the Tether has experienced a significant price change in recent times, primarily driven by bullish momentum. However, there is a noticeable retracement from a high around the $40.00 level, as seen in the current price movement. As it stands, the price appears to be oscillating within the lower segment of the Bollinger Bands, suggesting the pair’s direction is indecisive.
However, despite the current bearish development, the broader trend remains upwards as indicated by the lines of the Bands. To this end, the market sentiment shows participants await a breakout signal as Hyperliquid trades at $38.31 with over 100 thousand traded volumes for the day.
Technical Indicators
Major Resistance Levels: $39.50, $40.00, and $42.40
Major Support Levels: $37.00, $36.71, and $33.50
HyperLiquid Technical Analysis
The analysis of Hyperliquid against Tether on the daily timeframe shows the pair is currently consolidating. However, the MACD indicates the pair is still moving within the bearish zone, and the possibility of a potential reversal looms ahead.
On the other hand, the price appears to have been trading between the lower and upper dynamic lines of the Bollinger Bands for a prolonged period. However, as it stands, activities of the bearish traders appear to have been increasing in recent times with decreasing volume profile despite the overall trend.
To this end, a close below $37.00 in the current session would signal further movement to the south; otherwise, a break above $39.50 would push the price beyond $40.00.
HYPE/USDT Analysis: A Possible Pullback or Trend Continuation?
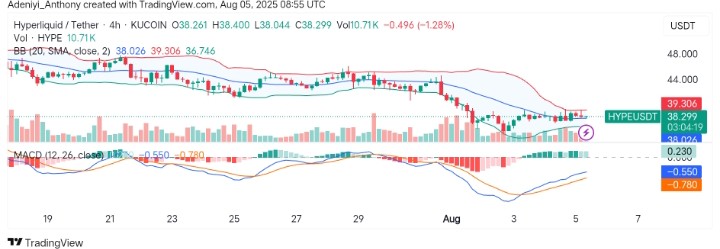
On the 4H timeframe, HYPE/USDT appears to be moving on a straight line, confirming the daily analysis. However, the price currently bounced off the dynamic mid-band level at $38.03, signaling a move towards the north as the histogram bar of the MACD displays a positive crossover.
From another angle, the market appears to have seen a reduced volatility as evidenced in the tightening Bollinger Bands, which indicate a breakout is imminent. To this end, if the $39.31 level is breached with increasing volume, the price might advance towards $42.00 in the coming sessions. On the flip side, any significant retracement could see the price testing the $36.71 support level.
You can purchase crypto coins here. Buy LBlock