Litecoin (LTC) Price Prediction: LTC/USDT Needs a Strong Catalyst
Estimated Reading Time: 3 minutes
Don’t invest unless you’re prepared to lose all the money you invest. This is a high-risk investment and you are unlikely to be protected if something goes wrong. Take 2 minutes to learn more
Litecoin (LTC) Price Prediction (April 8, 2025)
LTC/USDT Long-Term Trend: Bearish (Daily Chart)
The Litecoin market has fallen below its previous support at the $80 price level. Although it faced resistance breaching this support for some time, the token now trades below this critical threshold. Moreover, technical indicators continue to favor further downward retracements.
Key Price Levels:
Resistance: $75, $85, $95
Support: $70, $65, $60
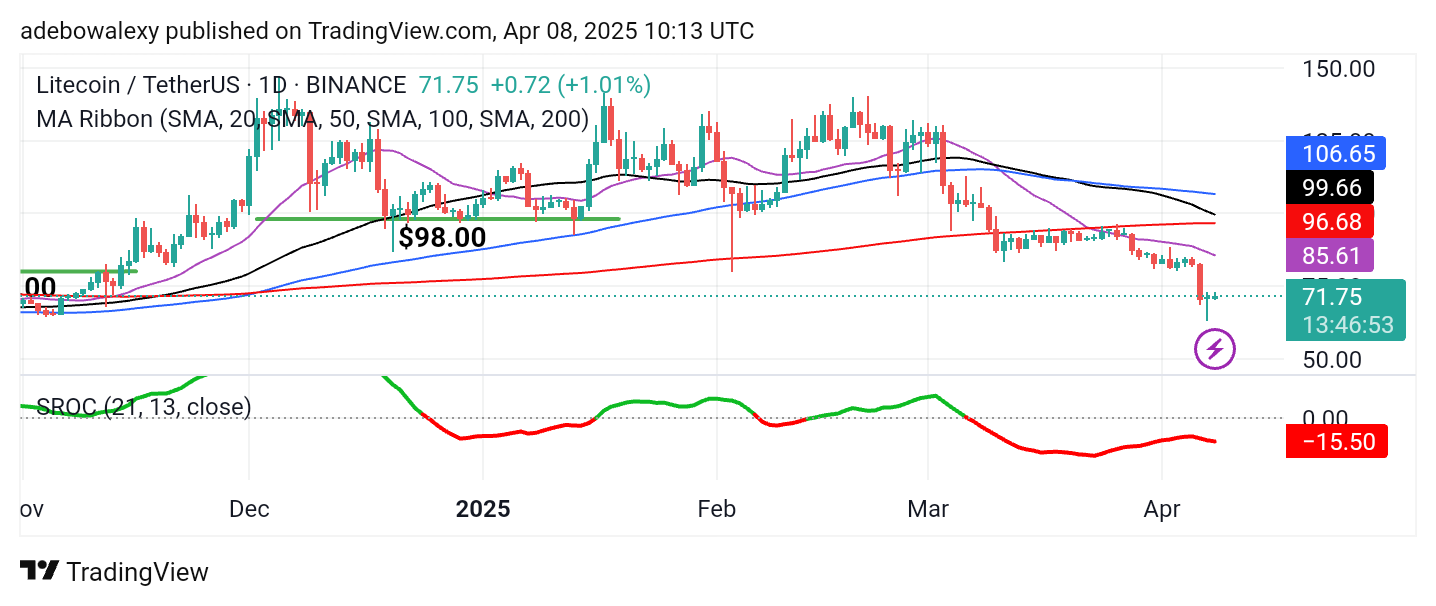
Price activity in the Litecoin daily market has retreated below significant technical landmarks. As a result, price action fell below the $80 level in the past two sessions. The last price candle on this chart is green but appears relatively small. The Stochastic Rate of Change (ROC) indicator lines lie below the equilibrium level and continue to show a downward trajectory.
Litecoin (LTC) Price Prediction: LTC/USDT Faces Strong Headwinds
As price action on the Litecoin daily chart continues to move lower, it remains below the $80 level, as previously mentioned. The market has shown some positive movement since the last session, evidenced by a slightly bullish price candle.
However, the current session’s candle, though green, has shown very limited upward movement. Meanwhile, the 50- and 200-day Moving Average lines are converging above the current price action, which could hinder any potential upward retracement. The trajectory of the Stochastic ROC also does not support a bullish outlook.
Litecoin (LTC) Price Prediction: LTC/USDT Upside Recovery Above $70 Appears to Fade
The 4-hour chart of the Litecoin market shows that price action recently retraced back above the psychological $70 mark. However, soon after crossing this threshold, bullish momentum began to fade, resulting in sideways movement just above the $70 level.
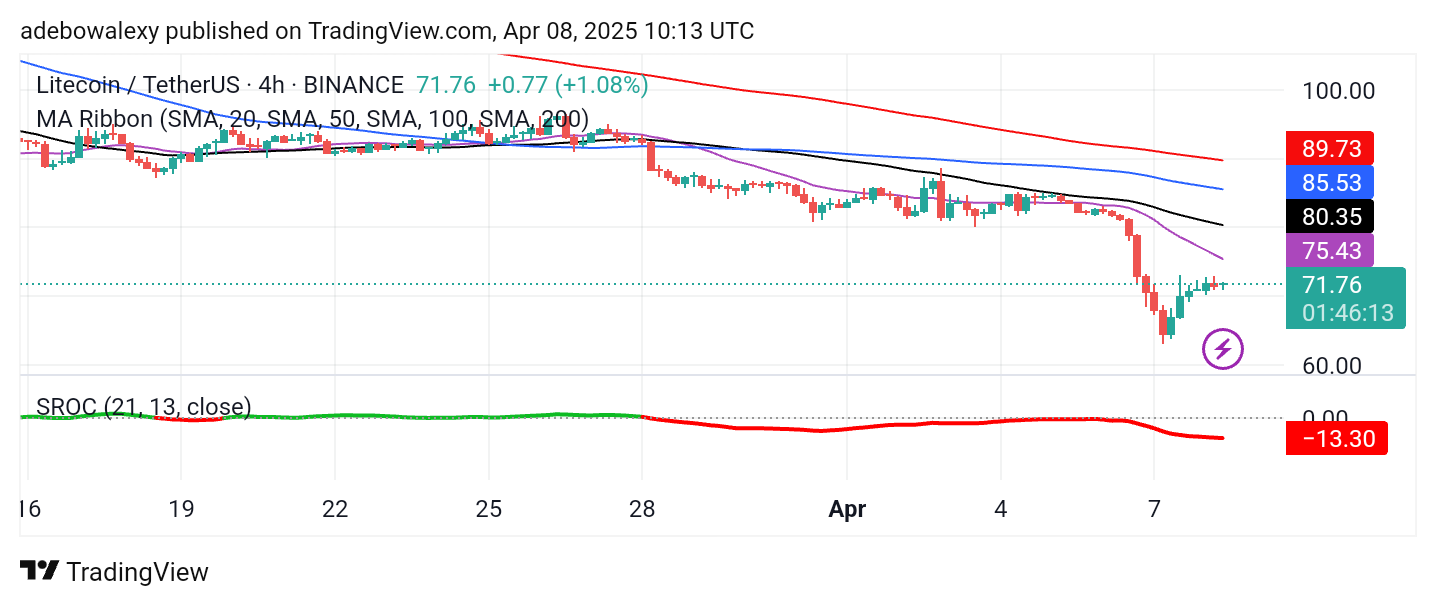
Price activity remains below all the Moving Average (MA) lines, and the Stochastic ROC indicator remains below the 0.00 level. Additionally, the Stochastic ROC lines still exhibit a slight downward slope. Consequently, traders considering buying the dip toward $90 on a short-term basis should monitor developments that may influence price movement in this market.