Litecoin (LTC) Price Prediction: LTC/USDT Retains Hopes of Pushing Higher
Estimated Reading Time: 3 minutes
Don’t invest unless you’re prepared to lose all the money you invest. This is a high-risk investment and you are unlikely to be protected if something goes wrong. Take 2 minutes to learn more

Date: June 10, 2025
Price action in the Litecoin market recently poked through a key technical level. Although the ongoing session is in the red, the token remains above crucial support and appears well-positioned for upward forces to propel it higher. A more in-depth analysis of the market is provided below.
LTC/USDT Long-Term Trend: Bearish (Daily Chart)
Key Price Levels:
Resistance: $95, $100, $105
Support: $85, $80, $75
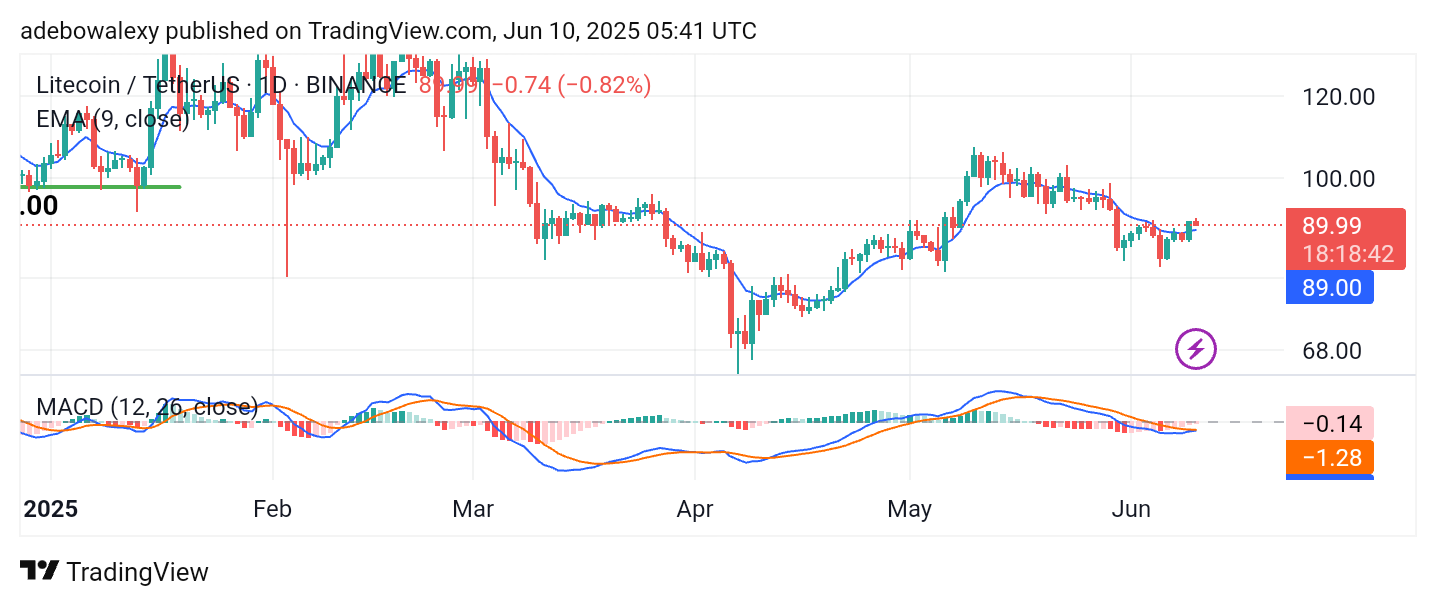
Price activity in the Litecoin market currently stands above the 9-day Exponential Moving Average (EMA) line. However, the most recent price candle, corresponding to the ongoing session, appears red—indicating a slight downward movement. Meanwhile, the Moving Average Convergence Divergence (MACD) indicator’s lines converge for a potential bullish crossover, still situated below the equilibrium level.
Litecoin (LTC) Price Prediction: LTC/USDT Seems Aligned for More Upward Movement
Although the ongoing session in the Litecoin market has shown a minor pullback, price action continues to hold above the 9-day EMA line. Technically, this suggests that the market may remain on an upward trajectory. Likewise, the convergence of the MACD lines indicates that bullish momentum still strongly influences the trend.
As a result, the pale red MACD histogram bars, which have appeared below the equilibrium level, are now beginning to fade. Combined with the fact that price action is still hovering above the 9-day EMA, this setup signals that the market has the potential for further gains.
Litecoin (LTC) Price Prediction: LTC/USDT May Proceed Through the $92 Mark
On the Litecoin 4-hour chart, the market appears to be consistently striving for higher ground. However, the last two price candles have turned red while remaining above the 9-day EMA line. Despite this, the price of LTC has increased compared to the daily chart and is trading at $90.01 at the time of writing.
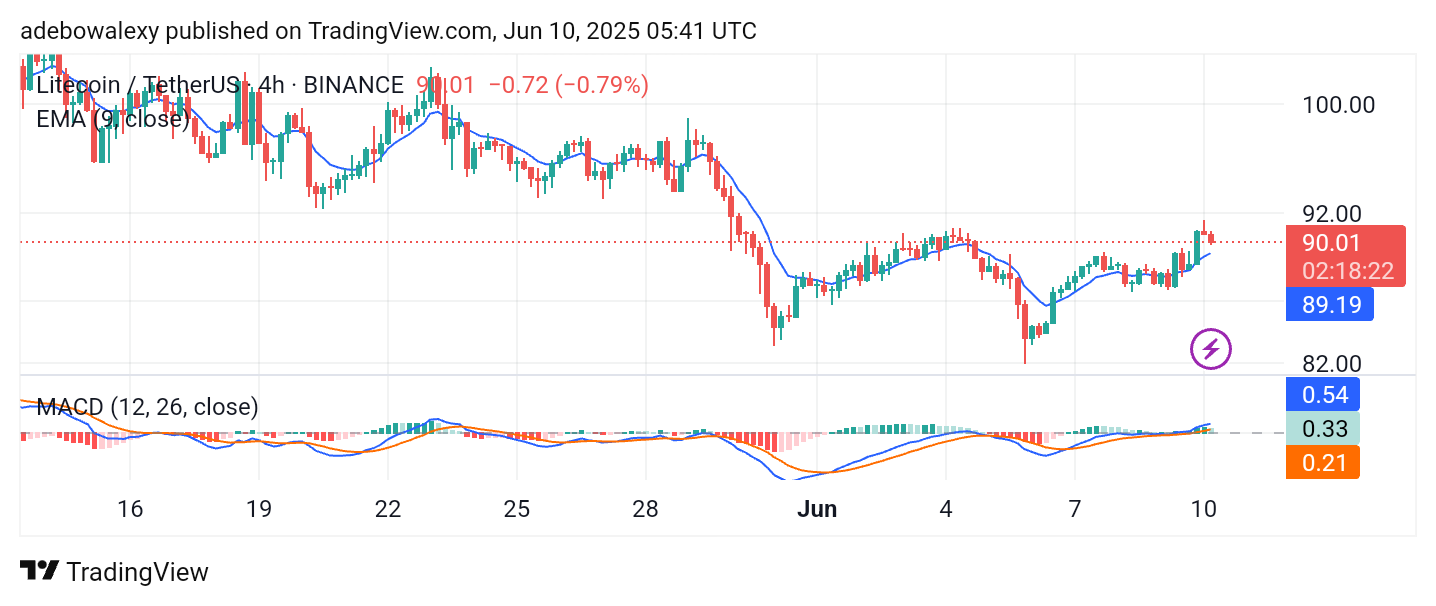
Similarly, the MACD line has moved above the equilibrium level, and the histogram bars are now green—signaling growing bullish momentum. Although the most recent bar is pale green, indicating a slight reduction in momentum due to the recent pullback, the overall outlook suggests that the market may soon breach the $92.00 resistance level.