Tamadoge (TAMA/USD) Consolidates Below $0.001, Poised for Breakout
Estimated Reading Time: 2 minutes
Don’t invest unless you’re prepared to lose all the money you invest. This is a high-risk investment and you are unlikely to be protected if something goes wrong. Take 2 minutes to learn more
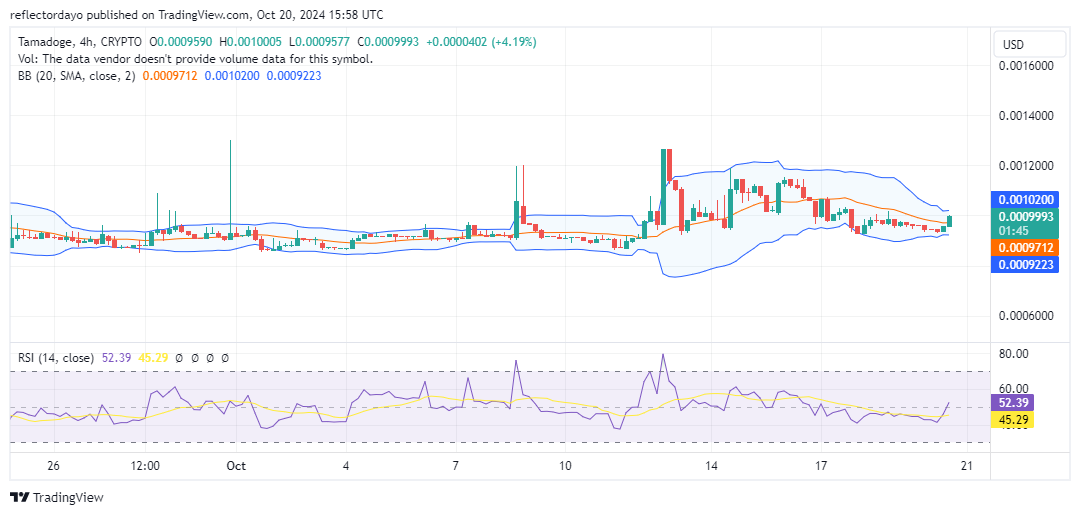
The Tamadoge market has been consolidating just below the key $0.001 price level for some time. However, in recent trading sessions, the market has shown momentum with the formation of a marubozu candlestick, signaling a push toward the $0.001 level. Traders are hopeful that the market will break above this resistance level, which has held firm over the past few sessions. A successful breakout above $0.001 could indicate a significant trend reversal and a potential rally.
Key Levels
- Resistance: $0.0013, $0.0014, and $0.0015
- Support: $0.0008, $0.00078 and $0.00074
TAMA/USD Price Analysis: The Indicators’ Point of View
Initially, technical indicators showed consolidation below the $0.001 price level. However, in the current trading session, the crypto signal has surged towards the $0.001 level with a significant bullish candlestick, bringing the current price to this key resistance point. This movement may be building pressure on the $0.001 level, potentially paving the way for further upward gains. The Relative Strength Index (RSI) currently reads 52, indicating moderate momentum as the bullish recovery continues. While this level suggests some bullish activity, it is not strong enough to signal a full-blown uptrend. Although there is still potential for bullish traders, the market remains near equilibrium, highlighting the need for increased bullish sentiment to drive the market higher.
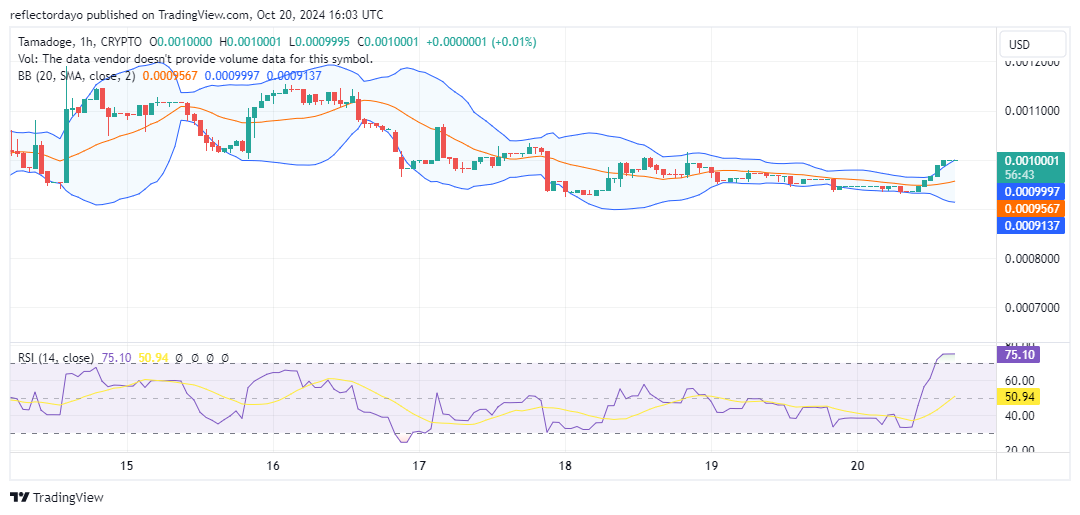
Tamadoge Short-Term Outlook: 1-Hour Chart
Zooming in on the 1-hour chart, the technical indicator suggests that the ongoing bullish trend in the Tamadoge market may be nearing its peak. Two doji candlesticks have appeared at the top of the bullish move, right at the $0.001 price level, signaling potential indecision in the market. This could lead to a shift in sentiment, with investors turning bearish and driving the price back towards the $0.00095 level. Supporting this outlook is the Relative Strength Index (RSI), which is currently above 70, indicating an overbought condition. Given this signal, a market correction is likely, which could result in a pullback to around $0.00095.