Tamadoge (TAMA/USD) Maintains Stability at $0.001
Estimated Reading Time: 2 minutes
Don’t invest unless you’re prepared to lose all the money you invest. This is a high-risk investment and you are unlikely to be protected if something goes wrong. Take 2 minutes to learn more

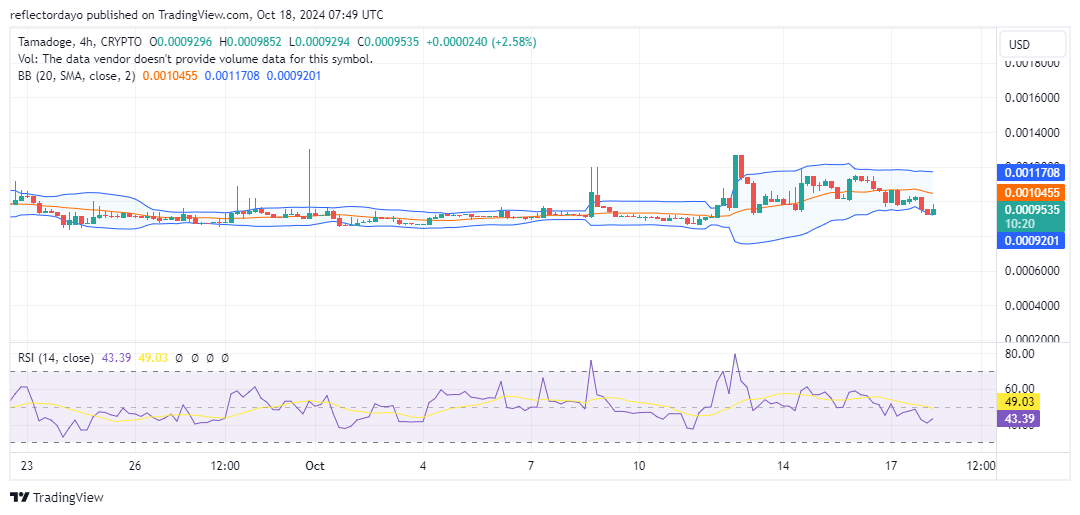
Following a sharp rally that pushed TAMA/USD to $0.00127, market volatility has noticeably increased. Typically, increased volatility gives bears an opportunity to take control, but the $0.001 level has emerged as a key support, showcasing the bulls’ strength. Their intervention at this level has solidified it as a reliable support zone, resulting in the market currently moving sideways as bulls at this support level just keep rejecting the bearish advances. Given the resilience shown by the bulls, there is potential for the price to retest the previous high of $0.00127.
Key Levels
- Resistance: $0.0013, $0.0014, and $0.0015
- Support: $0.0008, $0.00078 and $0.00074
TAMA/USD Price Analysis: The Indicators’ Point of View
The indicators reflect the TAMA/USD bulls’ persistence at the $0.001 level, despite the downward pressure that emerged at $0.00127. While the market has seen lower peaks, the support at $0.001 has remained intact, reinforcing bullish sentiment. With demand stabilizing around this price point, market volatility has subsided, as indicated by the narrowing Bollinger Bands. This reduction in volatility hints at a possible rebound in the crypto signal, potentially pushing the price back toward $0.00127, and possibly setting a higher support as it climbs.
Tamadoge Short-Term Outlook: 1-Hour Chart
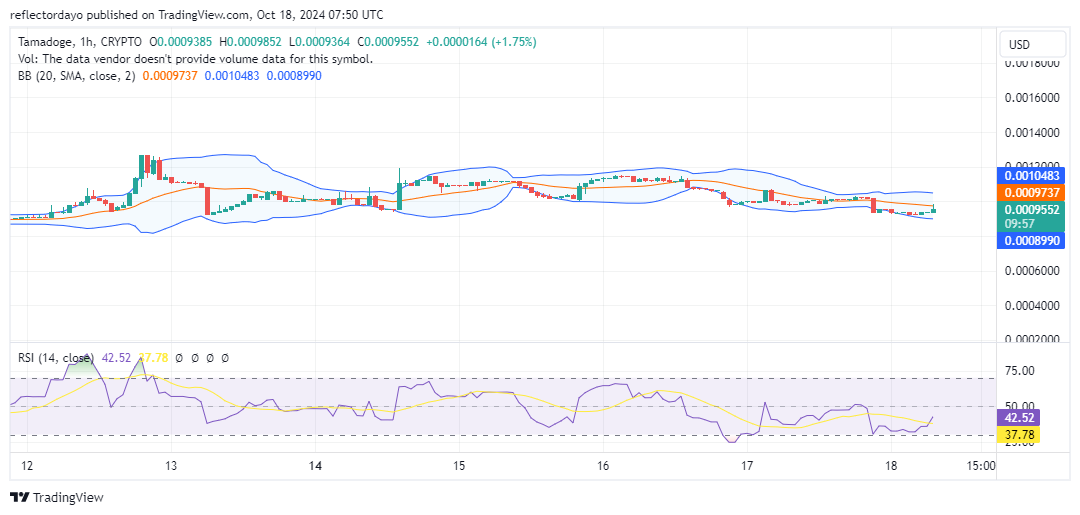
The 1-hour chart mirrors the sentiment on the 4-hour chart, confirming the broader market view. The downtrend in peaks remains visible, but the $0.001 level continues to act as a strong support, thwarting bearish efforts. Recently, the Bollinger Bands have tightened, indicating the price is consolidating within a narrow range around $0.001. This pattern suggests that the market could be gearing up for a significant movement, potentially targeting a rally back to $0.00127.