POL (ex-MATIC) Price Prediction: POL/USDT Descends Slightly to Lower Support
Estimated Reading Time: 3 minutes
Don’t invest unless you’re prepared to lose all the money you invest. This is a high-risk investment and you are unlikely to be protected if something goes wrong. Take 2 minutes to learn more

POL (ex-MATIC) Price Prediction (March 8)
The Polygon (ex-MATIC) market remains subdued, with recent trading activity showing a continued slight decline. Price action has been trending lower, and technical indicators suggest the possibility of further downward movement.
POL/USDT Long-Term Trend: Bearish (Daily Chart)
Key Price Levels:
Resistance: $0.2500, $0.3000, $0.3500
Support: $0.2000, $0.1500, $0.1000
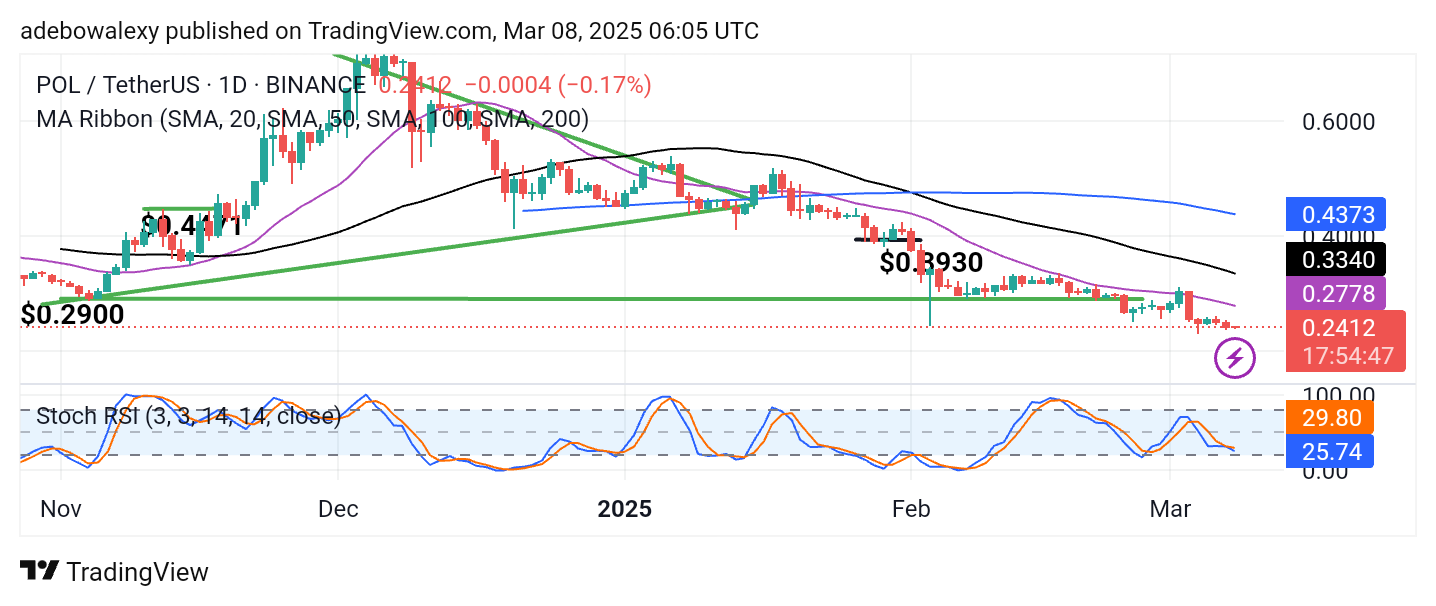
The POL (ex-MATIC) market has been trading below all the Moving Average (MA) lines on the daily chart since January. As a result, price action has been falling from one support level to another. The last price candle is small and red, signaling continued bearish pressure.
Furthermore, after a failed attempt to establish support above the $0.2900 price level, the Stochastic Relative Strength Index (RSI) has resumed its downward trajectory. The Stochastic RSI lines are now diverging as they fall deeper into the oversold zone, reinforcing the likelihood of further price declines.
POL (ex-MATIC) Price Prediction: Headwinds Continue to Dominate the POL/USDT Market
Price activity in the POL (ex-MATIC) market remains bearish, as seen in the formation of recent price candles. Additionally, since price action continues to stay below all the available MA lines, this market outlook remains pessimistic.
The latest price candle does not indicate a significant shift in sentiment. Similarly, the Stochastic RSI has resumed a bearish path, with its lines continuing to trend lower into the oversold region. Technically, this suggests that the market is not showing signs of an upside reversal in the short term.
POL (ex-MATIC) Price Prediction: POL/USDT Bulls Remain Overwhelmed (4-Hour Chart)
In the POL/USDT 4-hour market, price action continues to maintain a downward trajectory below all the MA curves. Although the last price candle appears green, it remains below all the MA lines, indicating that bullish momentum is weak.
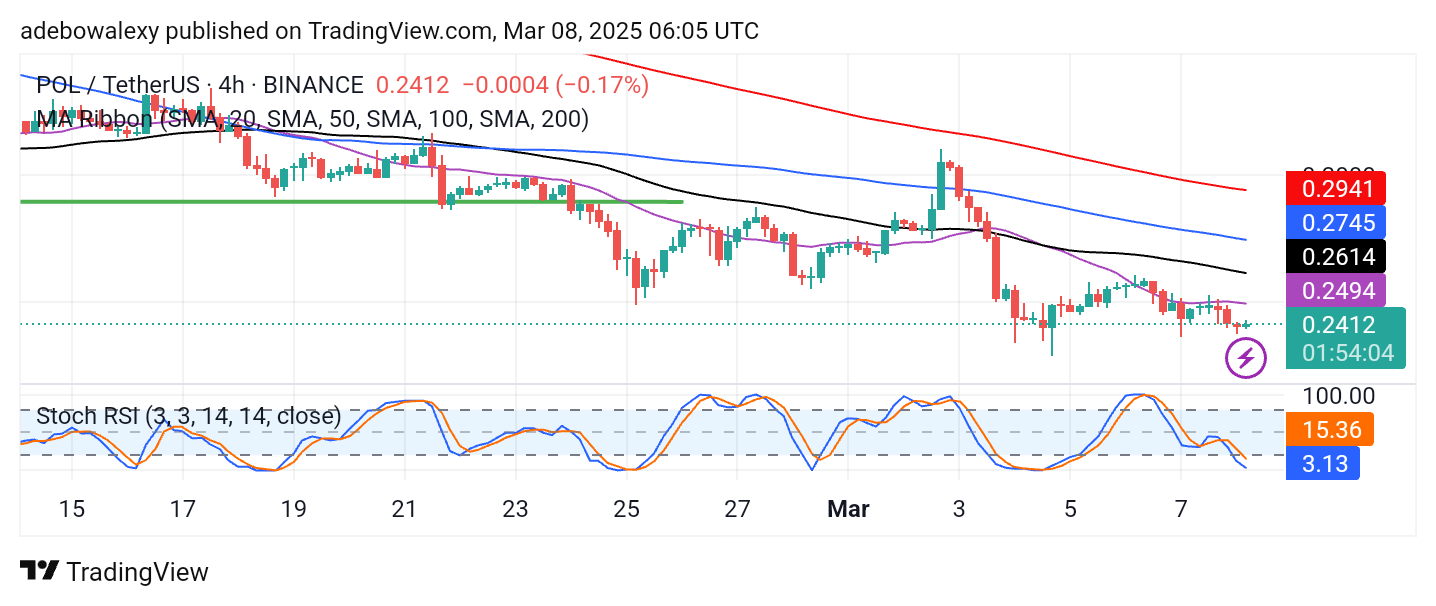
Additionally, the Stochastic RSI lines are still falling deeper into the oversold region. The lead line of this indicator is nearing its terminal level, suggesting that downward forces are at their strongest. Consequently, this implies that bearish activity may drive prices lower toward the $0.2000 price level.