Solana (SOL) Price Prediction: SOL/USDT Sustains Above the $140 Mark
Estimated Reading Time: 3 minutes
Don’t invest unless you’re prepared to lose all the money you invest. This is a high-risk investment and you are unlikely to be protected if something goes wrong. Take 2 minutes to learn more

Solana Price Prediction (March 7)
The Solana market remains largely bearish despite showing minimal recovery. The behavior of price movement suggests that bullish forces are still generally overwhelmed. However, some positive signs in this market could develop into something more promising.
SOL/USDT Long-Term Trend: Bearish (Daily Chart)
Key Price Levels:
Resistance: $150.00, $160.00, $170.00
Support: $140.00, $130.00, $120.00
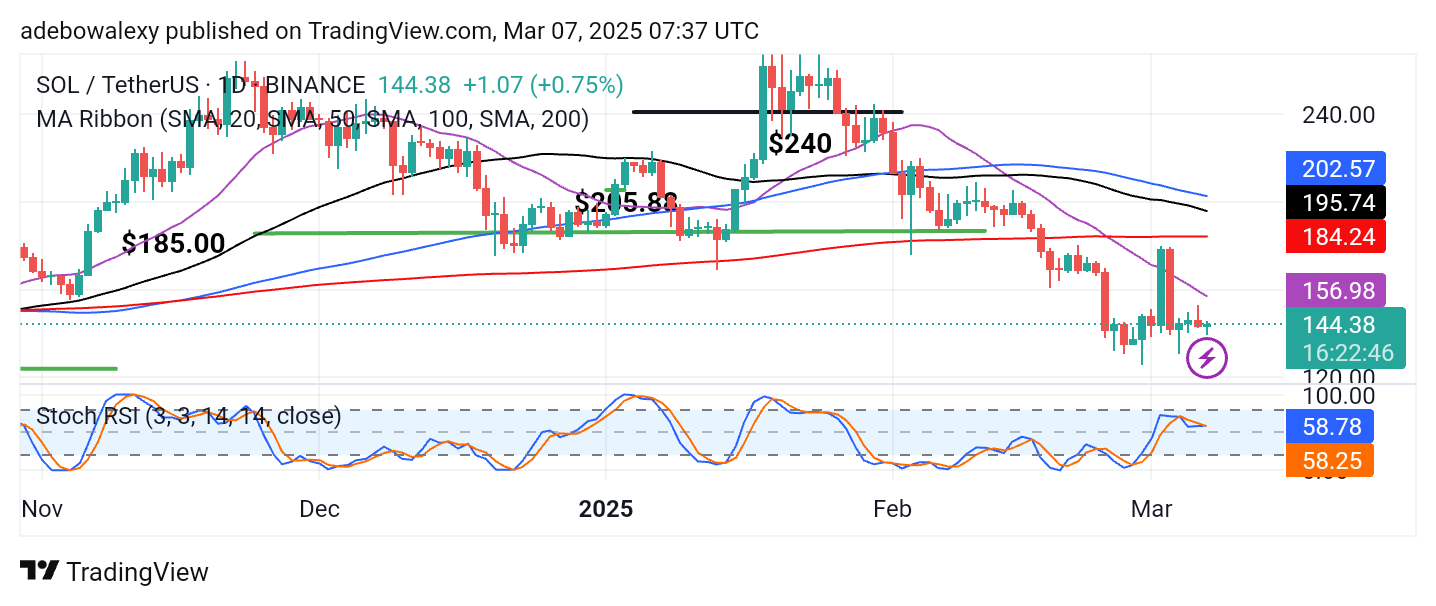
The ongoing session indicates that some price action is attempting to regain higher ground. The last price candle appears green and resembles a hammer candle, signaling potential bullish intent. Nevertheless, trading remains confined below all the Moving Average (MA) lines. Additionally, the Stochastic Relative Strength Index (RSI) lines are converging for a crossover above the 50 mark, which could indicate a shift in momentum.
Solana Price Prediction: SOL/USDT Bulls Are Eyeing Short-Term Gains
The ongoing session in the Solana market suggests that control of price movement is highly contested. The appearance of the last price candle indicates that bullish forces are actively pushing the market upward, but bearish pressure remains strong enough to hold them back. As a result, price action remains below all the MA lines on the chart.
Meanwhile, the Stochastic RSI lines are forming a crossover just above the 50 level. This suggests that while bearish forces still dominate for now, a successful bullish crossover on the Stochastic RSI could signal a potential trend reversal.
Solana Price Prediction: SOL/USDT Bulls Protect the Integrity of the $140 Support (4-Hour Chart)
Price action in the Solana 4-hour market has managed to stay above the psychological support at the $140 price level. The last price candle on the chart is green, signaling buyers are actively participating. Moreover, price action has moved past the 20-day MA curve and is already testing the 50-day MA line.
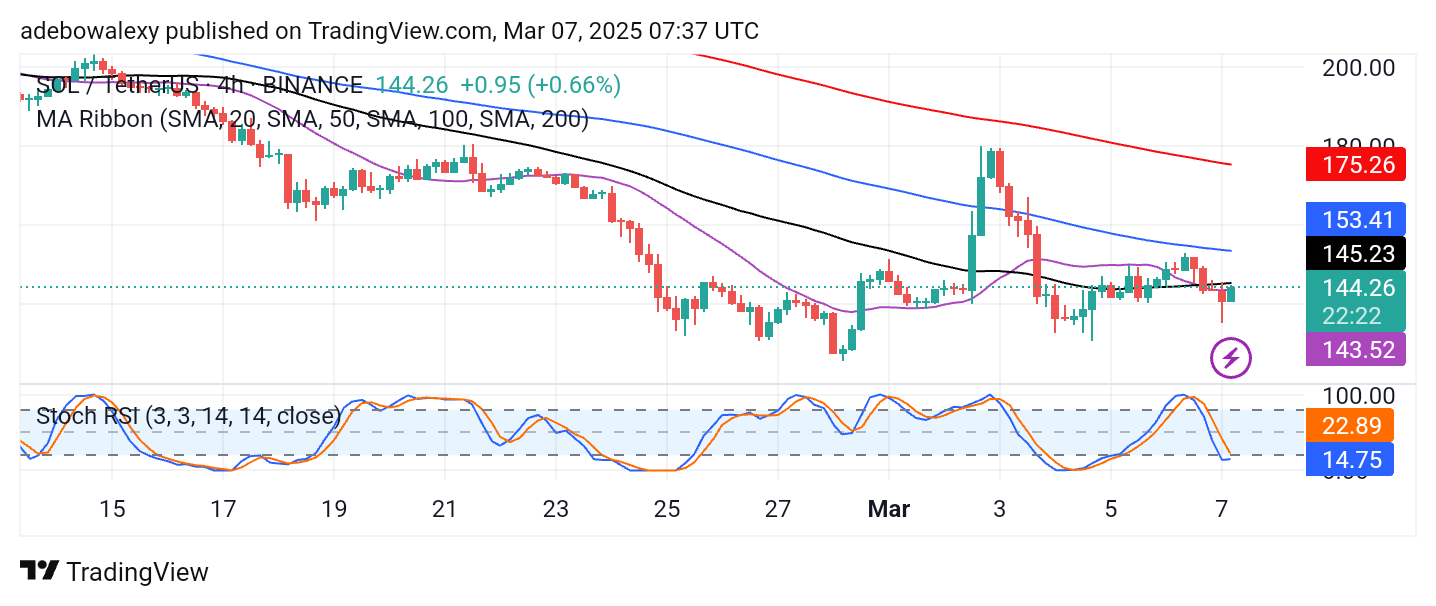
Additionally, the Stochastic RSI lines have formed a crossover, indicating growing bullish momentum. As a result, traders may look to target nearby resistance levels, such as the $150 price mark, for short-term gains.