Quant Price Prediction: QNT/USD Aims the $79.91 Resistance Level
Estimated Reading Time: 3 minutes
Don’t invest unless you’re prepared to lose all the money you invest. This is a high-risk investment and you are unlikely to be protected if something goes wrong. Take 2 minutes to learn more

Quant Price Prediction: September 25, 2024
The QNT/USD pair has been on a prolonged downtrend since the fifth month of this year. Quant is trading at $79.42 with a slight percentage increase from the previous value. However, there has been a noticeable upward momentum after consolidation.
The Guppy Multiple Moving Averages (GMMA) signal trend reversal, while the Stochastic Relative Strength Index suggests caution. There might be further room for growth very soon if volume and momentum hold.
QNT/USD Long-term Trend: Bearish (Daily Chart
Key Levels
Resistance Levels: $79.91, $100.00, and $120.0
Support Levels: $78.19, $77.31, and $76.2
Before now, the QNT/USD pair has been on an extended downtrend. However, there might be a correction to the upside as the pair eyes immediate resistance levels.
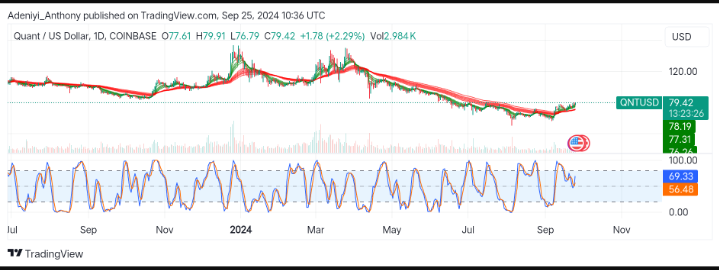
The price action of the pair suggests a potential reversal to the north is on the horizon. Therefore, traders are closely watching to calculate future movements.
Quant Price Prediction: Condition for Sustained Bullish Momentum
According to the group of exponential averages, QNT/USD has seen a slight upward movement. This is an action backed up by the GMMA’s bullish crossover.
The faster exponential multiple averages are heading for the north towards $79.91. However, the price will need to pierce through this level for confirmation.
On the other hand, the Stochastic RSI signals the pair is near the overbought zone. Therefore, traders should watch closely because there might be a short-term pullback before another upward movement.
This upward trajectory will be cemented only if there is an increased volume and sustained bullish strength
QNT/USD Short-term Trend: Bullish (4H Chart
The Quant against the U.S. Dollars on the 4H chart formerly appeared to be in a ranging phase. The current price action suggests the pair might break the $79.91 level, which could open the door to higher resistance levels
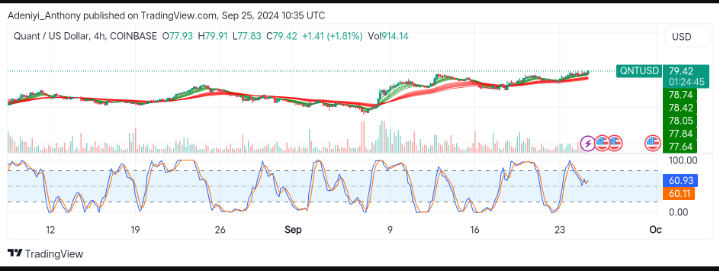
Despite slight retracement at the $79.91 level, the Stochastic RSI suggests the pair has not reached the overbought region; the moving averages are sloping upward. This is an indication that the bullish trend might continue
However, the pair trades at $79.42, a small positive difference from the previous session. Traders should trade cautiously, as a reduction in the trading volume compared to the last session might trigger a downtrend
In order to place winning trades with us via Bybit, you can open an account here.