Solana (SOL) Price Prediction: Solana Consolidates Above the $165.00 Price Line
Estimated Reading Time: 3 minutes
Don’t invest unless you’re prepared to lose all the money you invest. This is a high-risk investment and you are unlikely to be protected if something goes wrong. Take 2 minutes to learn more

Solana (SOL) Price Prediction: May 31
If considered from a broader perspective, the Solana market has been obtaining higher support levels this month (May). At this point, price action seems to have found another higher support. However, it could be seen that the market has found it difficult to pick up from that baseline.
SOL/USDT Long-term Trend: Bullish (Daily Chart)
Key Levels:
Resistance Levels: $180.00, $200.00, and $220.00
Support Levels: $160.00, $140.00, and $120.00
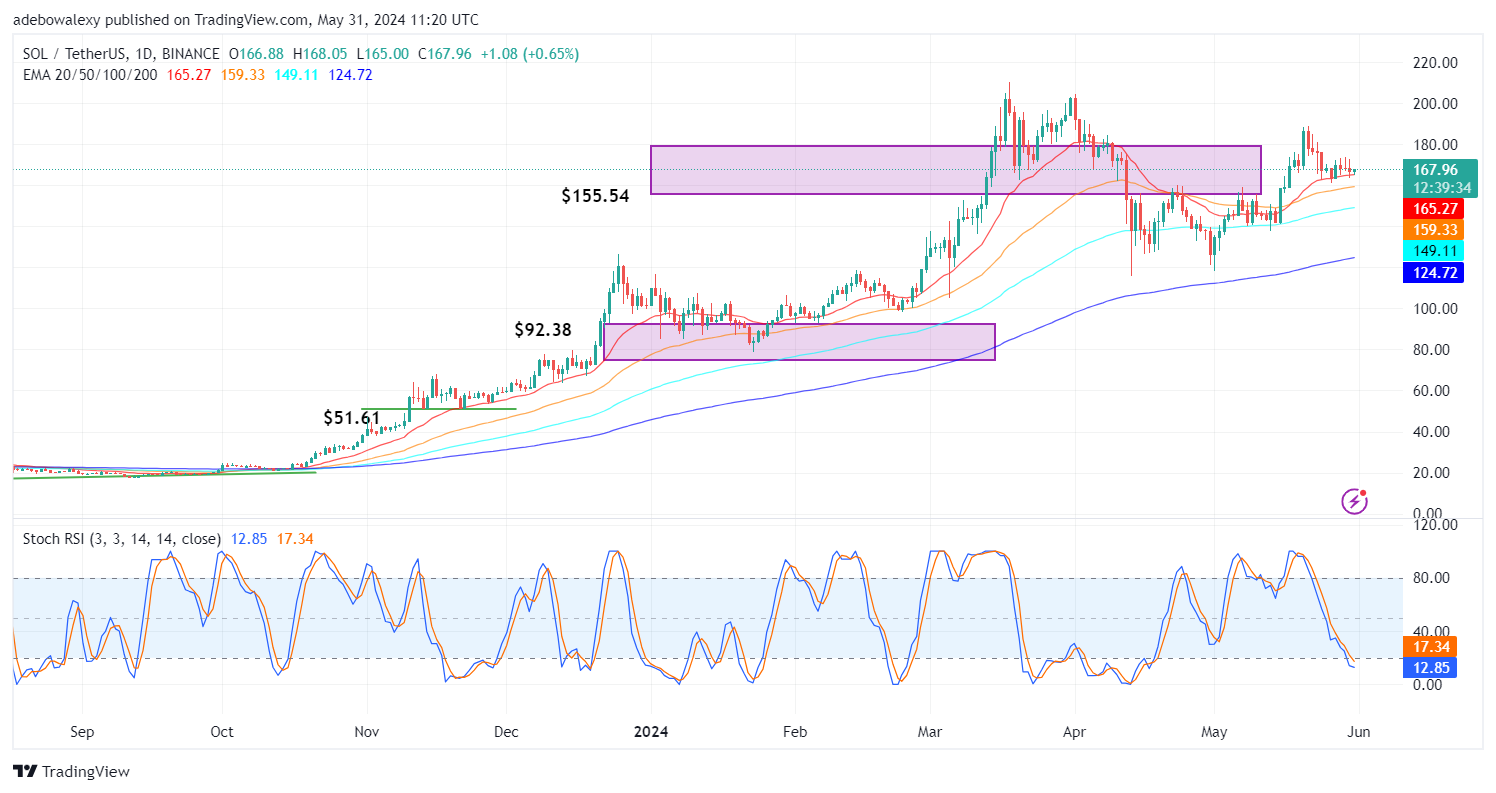
Price activity in the SOL market has broken the resistance at the $165.00 mark. Despite that, the market seems to lack what it takes to take off significantly from this mark. More precisely, recent price candles can be seen standing above the 20-day Exponential Moving Average (EMA) line. It is worth noting that all other EMA lines are also below-price activity. Meanwhile, the Stochastic Relative Strength Index (SRSI) lines have reached deep into the oversold region, with a deflection on the leading line of this indicator.
Solana Price Prediction: Will Bulls in the SOLUSDT Market Resume Action Soon?
Price action in the Solana market has found a strong support level at the 20-day EMA line. Also, the mentioned support lies above all other EMA lines. By implication, this means that bulls may resume impacting the market anytime soon. In addition, the last price candle here can be seen appearing green above the EMAs, even with its tiny body.
Furthermore, while price action remains above all EMA lines, it can be seen that the SRSI indicator lines have fallen deep into the oversold region. Also, the perceived deflection on the indicator’s leading lines suggests that upside momentum may pick up soon and perhaps find support above the $180 price level.
SOL/USDT Medium-term Trend: Solana Bulls Stay at Advantage (4H Chart)
In the Solana market over a 4-hour timeframe, we can see that the mentioned higher support stays intact. However, very recently, it has been seen that price movement has fallen below the 20 and 50-day EMA lines. Meanwhile, the last price candle on this chart has found support at the upward-sloping trendline on this chart. Additionally, we can see that the SRSI indicator lines have delivered a bullish crossover just below the 50 level of the indicator.
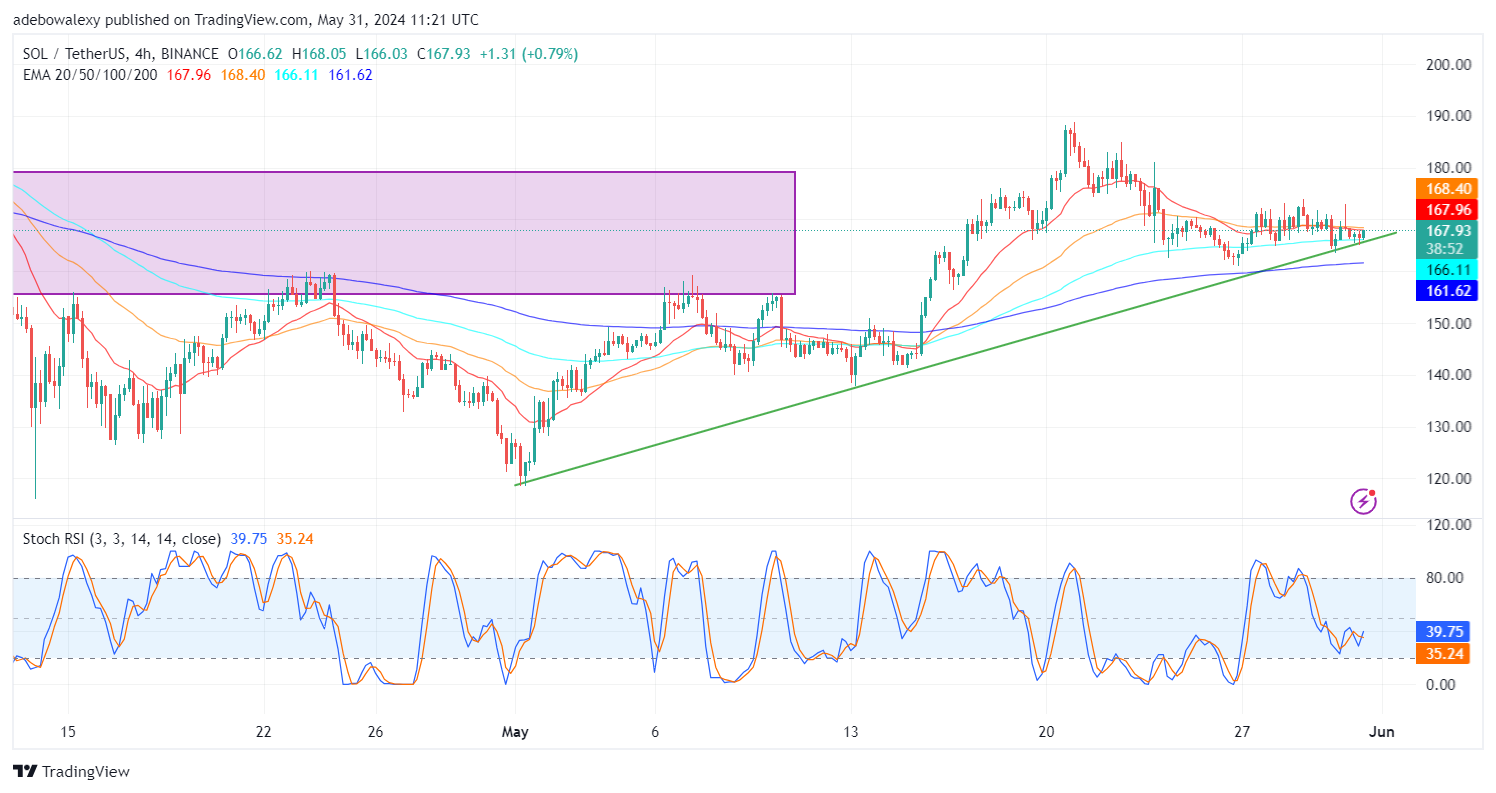
From a technical point of view, it appears that the market can gain considerable momentum. The crossover on the SRSI is young, while the last price candle on the chart is preparing to break the resistance at the 20-day EMA lines. Therefore, it seems likely that the resistance level at $180.00 will be broken and price action may approach the $185.00 mark.