Uniswap Price Prediction: UNI/USDT Market Stays Afloat Despite Downward Retracement
Estimated Reading Time: 3 minutes
Don’t invest unless you’re prepared to lose all the money you invest. This is a high-risk investment and you are unlikely to be protected if something goes wrong. Take 2 minutes to learn more

Uniswap Price Prediction for November 7
The Uniswap market recently experienced one of the largest price jumps in recent times. This surge coincided with Bitcoin’s all-time high, which ignited a broader cryptocurrency market rally. As a result of this significant price movement, market participants may anticipate some volatility in the market.
UNI/USDT Long-Term Trend: Bullish (Daily Chart)
Key Price Levels:
Resistance: $9.50, $10.50, $11.50
Support: $8.50, $7.50, $6.50
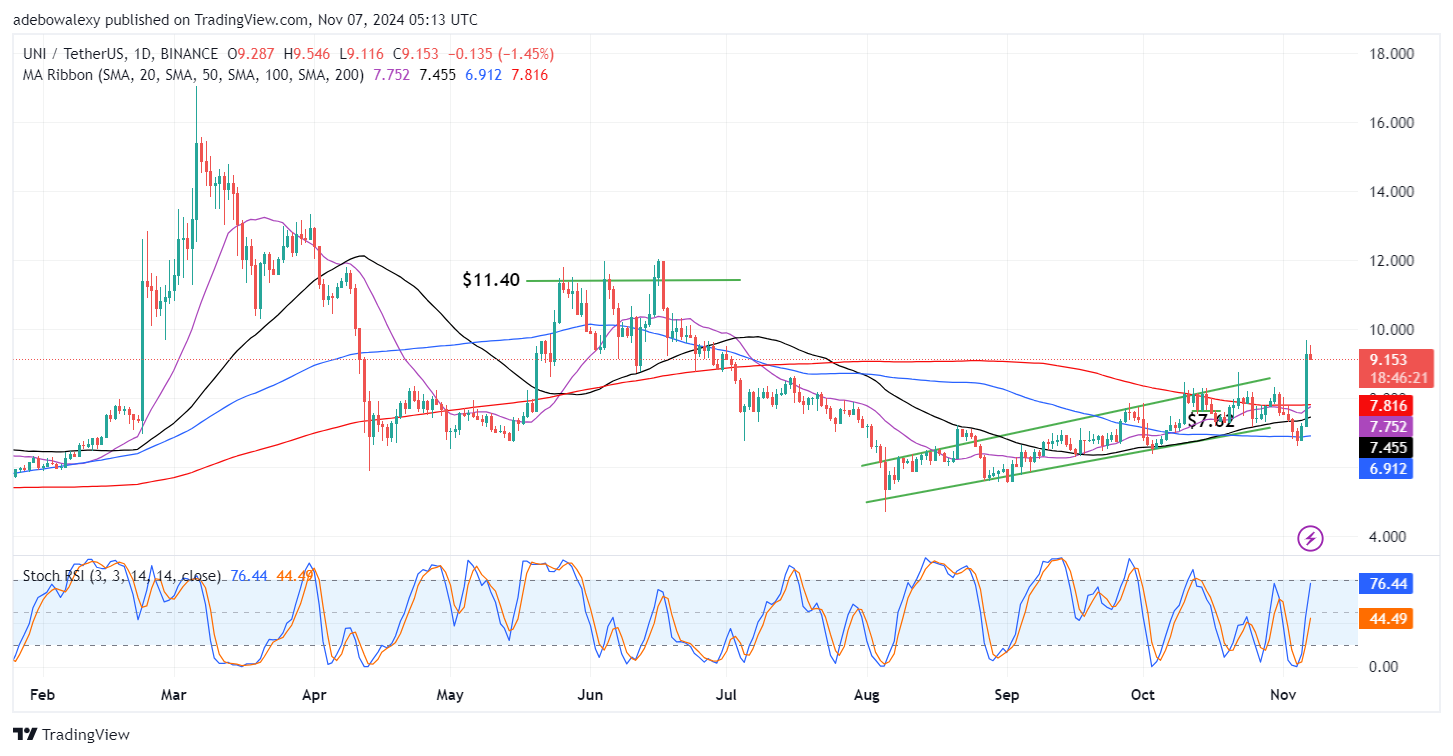
The previous session was marked by a massive green candle on the chart. Upward momentum was strong yesterday, and the session retained most of its gains. However, today’s trading activity has seen a downward correction, represented by a red candle. While this candle is relatively small, it is still significantly above the moving average lines. Additionally, the 20-day and 200-day Moving Averages are approaching a bullish crossover below the price action. Similarly, the Stochastic Relative Strength Index (RSI) lines are still rising sharply into the overbought region, despite the modest downward retracement.
Uniswap Price Prediction: UNI/USDT Bulls Are Still Protected
While today’s Uniswap trading has seen mild losses, the upside potential still appears protected. The downward retracement is still well above the moving average lines. Moreover, the 20-day and 200-day Moving Averages are converging below the price action, which is a bullish indicator.
The Stochastic RSI lines are also rising steeply into the overbought region. Interestingly, they have not responded to today’s downward retracement. This further confirms that the upside momentum may still be intact, and the market could continue its upward trend.
Uniswap Price Prediction: UNI/USDT Downward Retracement May Hit a Nearby Support (4-Hour Chart)
The Uniswap 4-hour chart reveals that the downward retracement has extended over multiple sessions. However, the token is still trading significantly above the moving average lines. All moving average lines are crossing below the price action. Additionally, the Stochastic RSI lines are now falling slightly towards the 90 level of the indicator after spending some time near the 100 level.
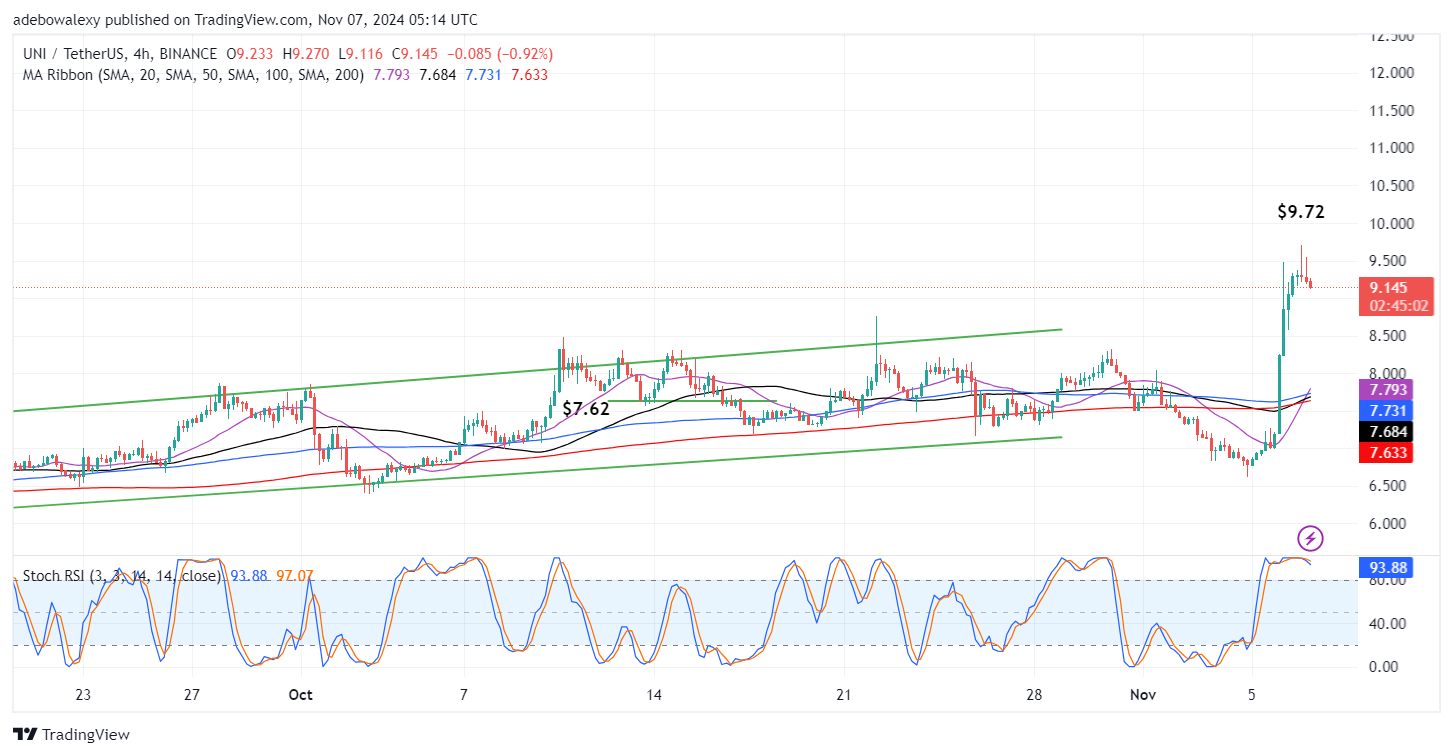
Although the downward retracement has persisted for several sessions and momentum appears to be increasing, the $9.00 support level may provide support. Consequently, bullish traders may consider entering the market at the $9.00 level, as prices could potentially rise towards the $10.00 level.