Uniswap (UNI) Price Prediction: UNI/USDT Fails to Break the Resistance at the $8.00 Mark
Estimated Reading Time: 3 minutes
Don’t invest unless you’re prepared to lose all the money you invest. This is a high-risk investment and you are unlikely to be protected if something goes wrong. Take 2 minutes to learn more

Uniswap (UNI) Price Prediction: July 18
Price action in the Uniswap daily market has corrected upward following the recent momentum gain of Bitcoin. However, the correction soon met a strong barrier that rejected further upside moves. As a result, the market quickly relinquished its previous gains.
UNI/USDT Long-term Trend: Bearish (Daily Chart)
Key Price Levels:
Resistance Levels: $8.00, $10.00, and $12.00
Support Levels: $6.00, $4.00, and $2.00
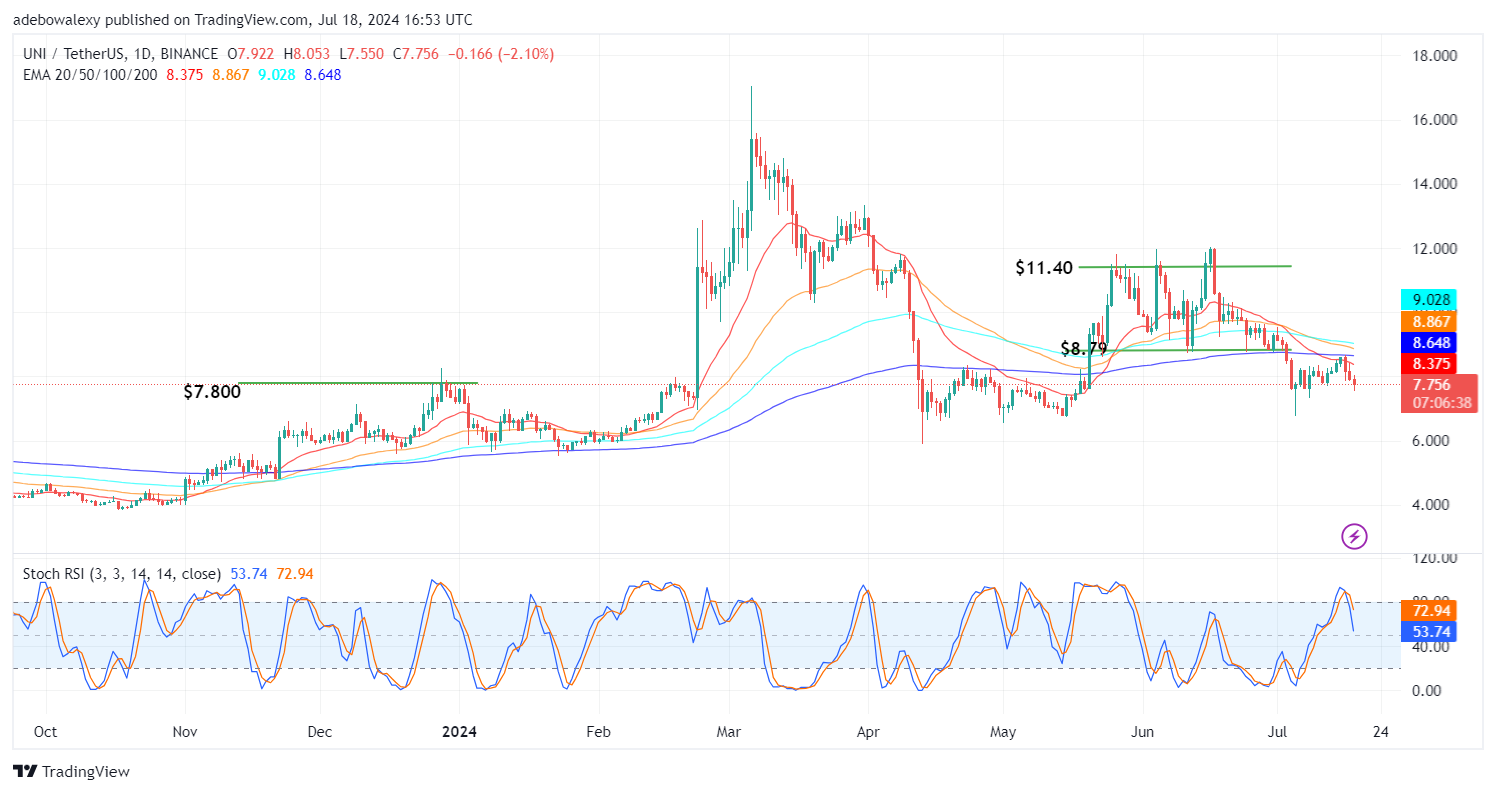
The above-mentioned barrier was constituted by the 200-day Exponential Moving Average (EMA) line. It can be seen that the market has stayed consistently bearish ever since it tested the indicator line. This has returned the market below all the EMA lines. Also, the Stochastic Relative Strength Index (SRSI) lines can be seen plunging steeply downward after a crossover deep in the overbought region.
Uniswap Price Prediction: UNI/USDT Is Bearish Straight Up
Signs arising from technical indicators used in the Uniswap daily market all suggest that headwinds are dominant. This has kept the market trending southward. The last price candle here is red in appearance and still below the $8.00 mark. Also, it was earlier mentioned and can be seen that price action is below all the EMA lines.
Additionally, the trajectory of the SRSI indicator predicts only one thing: downward forces are still ravaging the market. Consequently, this may cause further price declines to take place, as traders will likely pick up more bearish sentiment at this point.
UNI/USDT Medium-term Trend: Uniswap Looks Burdened (4H Chart)
Uniswap’s Price activity stays subdued below all the EMA lines, even in the 4-hour price chart. The ongoing session has presented a very minimal upside correction. Yet the market remains a considerable distance below the EMA lines. Likewise, the SRSI indicator lines are deep in the oversold region. This indicator line had earlier taken an upward bearing but has converged and merged while still retaining an upward bearing.
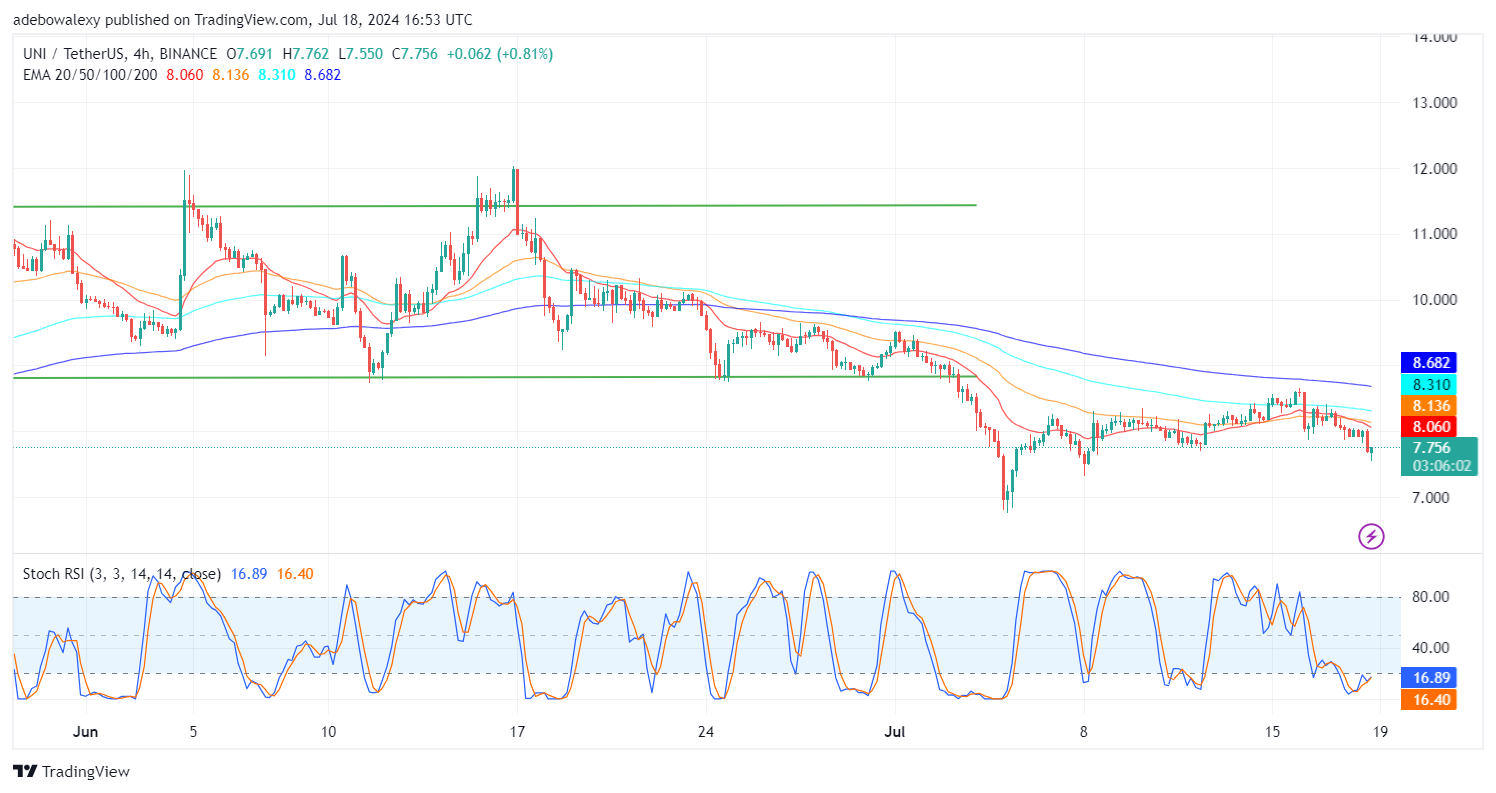
The observed upside correction and the trajectory of the SRSI lines seem to hold very little hope for price movement. This stems from the position of price action in the price chart. Therefore, it seems traders should brace for impact at the $7.00 mark.