Uniswap (UNI) Price Prediction: UNI/USDT Tears Down the $4.00 Baseline
Estimated Reading Time: 2 minutes
Don’t invest unless you’re prepared to lose all the money you invest. This is a high-risk investment and you are unlikely to be protected if something goes wrong. Take 2 minutes to learn more

Date: February 5, 2026
Bears in the Uniswap market have been on a winning streak. As a result, the market has continued to slide toward lower price levels. Even in the current session, headwinds remain dominant and may keep pushing the market further downward.
UNI/USDT Long-Term Trend — Bearish (Daily Chart)
Key Price Levels
Resistance: $4.00, $4.50, $5.00
Support: $3.50, $3.00, $2.50
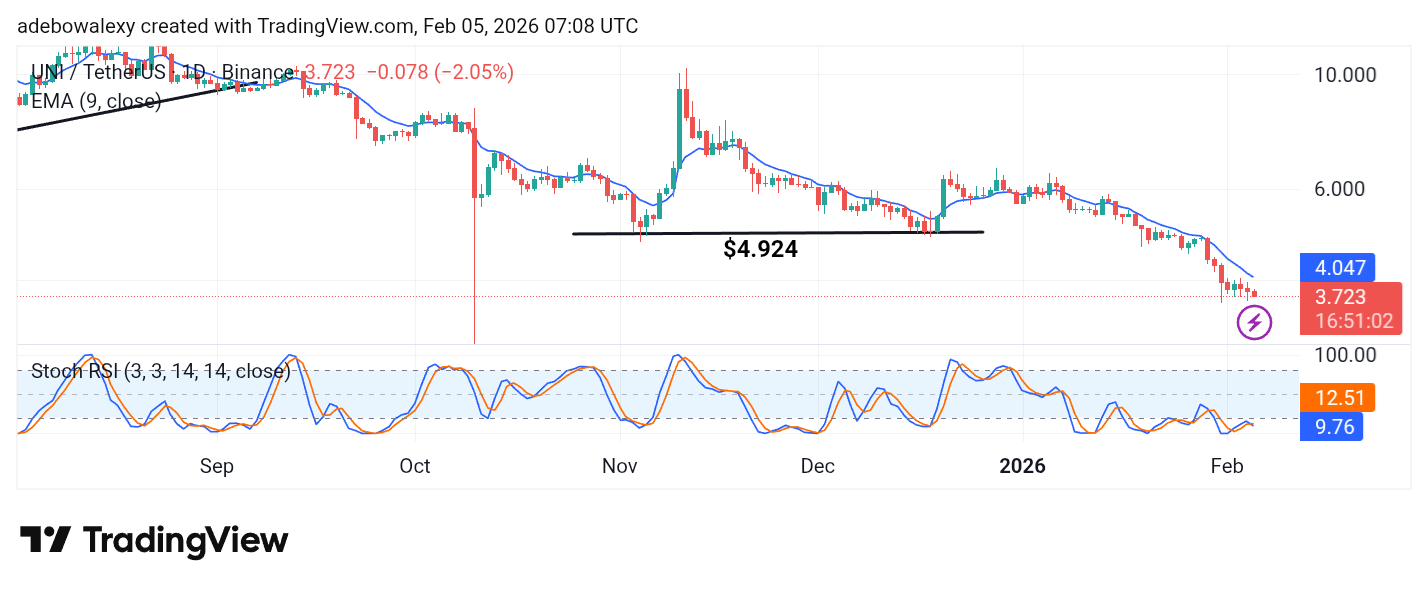
The Uniswap market has continued its descent to lower price levels. In the ongoing session, bearish sentiment remains evident, as reflected by the most recent price candle on the chart. Consequently, trading remains below the 9-day Exponential Moving Average (EMA). The Stochastic Relative Strength Index (SRSI) indicator lines are also sliding deeper into the oversold region. Meanwhile, the indicator has just delivered a bearish crossover within the oversold zone.
Uniswap Price Prediction: UNI Heads Strongly South
Price activity in the Uniswap daily market has remained decisively bearish for most of the past sessions. For more than seven days, price action has steadily declined toward lower thresholds.
The market has now breached the $4.00 baseline and continues to trade with a bearish bias. With price action staying below the 9-day EMA curve, the market may extend its decline toward even lower levels. The behavior of the SRSI indicator further suggests renewed bearish momentum following its recent downward crossover.
Uniswap Price Prediction: UNI/USDT May Touch Down at the $3.50 Level (4-Hour Chart)
Even on the 4-hour chart, the Uniswap market continues to trend southward. The most recent price candle maintains a bearish posture and remains below the 9-day EMA curve. This caps upside momentum and reinforces bearish sentiment.
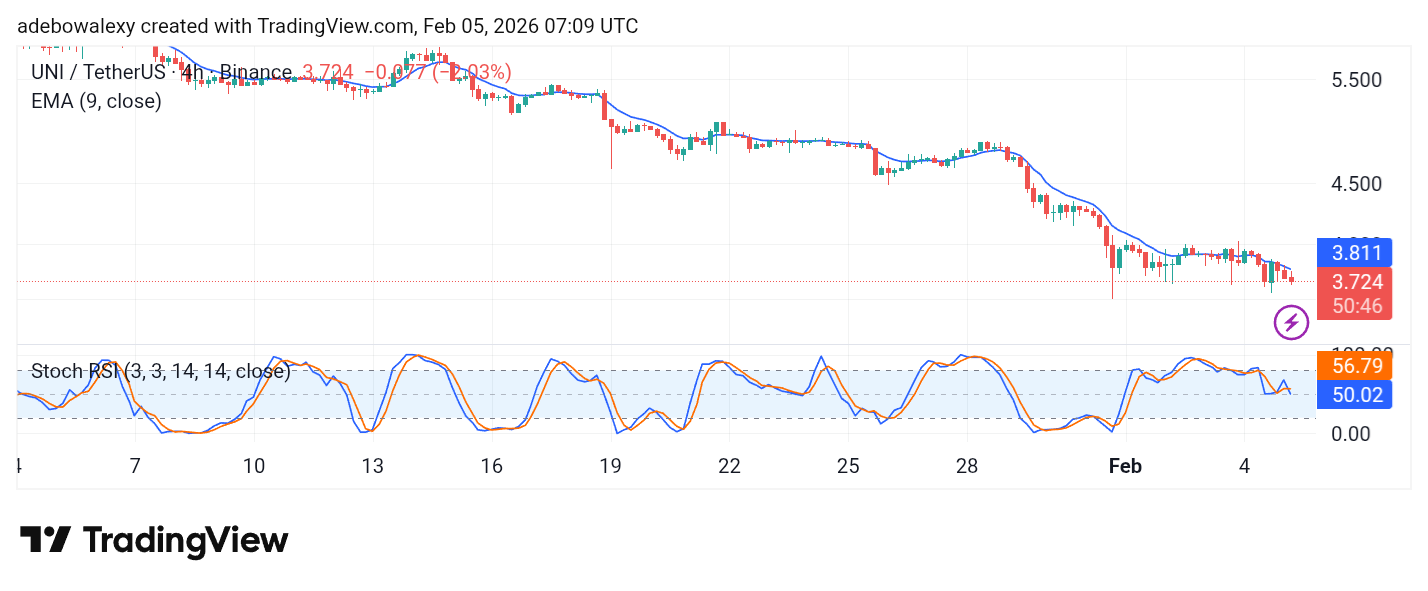
Furthermore, the SRSI indicator lines have just delivered a downward crossover, with the subsequent movement maintaining a southward trajectory. Consequently, traders may increasingly favor bearish positions targeting the $3.50 and $3.00 price levels.