Wall Street Memes (WSM/USD) Market Holds Basis, Hiking Moves
Estimated Reading Time: 3 minutes
Don’t invest unless you’re prepared to lose all the money you invest. This is a high-risk investment and you are unlikely to be protected if something goes wrong. Take 2 minutes to learn more
Wall Street Memes Price Prediction – January 24
Price actions that have surfaced to the downside of the indicators have continued to make headway toward letting the WSM/USD market bulls regain decent entries at lower ends, as the present financial condition shows that the crypto-economic market holds basis, hiking moves.
Given that selling forces have been unable to breach below the lower region of the Bollinger Bands on several occasions, the events leading to hiking advances exhibit the features of promissory rising signals. You will potentially lose money if you keep trying to sell heavily along with the lower section of the indications.
WSM/USD Market
Key Levels
Resistance levels: $0.0012, $0.0017, $0.0022
Support levels: $0.0007, $0.0005, $0.0003
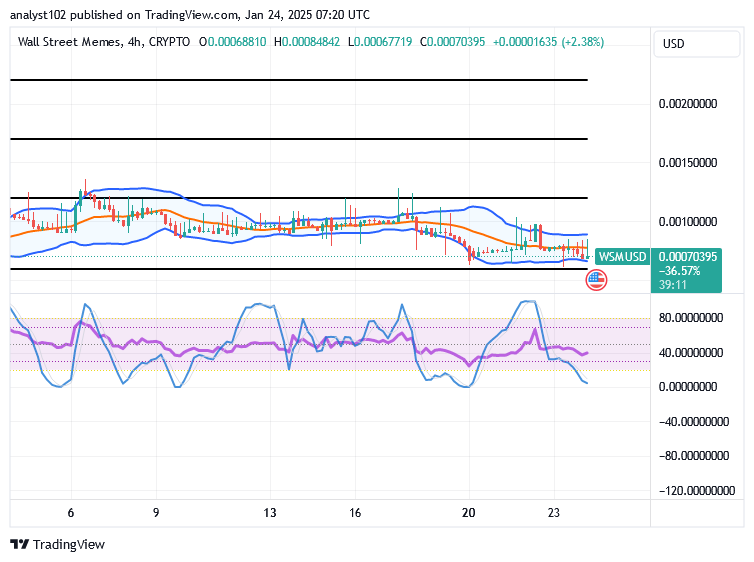
WSM/USD – 4-hour Chart
The WSM/USD market 4-hour chart showcases that the crypto-economic market presently holds basis, hiking moves.
The systemic positioning patterns displayed by the trend lines of the Bollinger Bands have allowed the WSM/USD traders to take appropriate, decisive action with regard to longing position orders. A warning note against obtaining better bargains in the direction of further dips in the stochastic oscillators was raised when it was discovered that they had veered southward into the oversold zone.
As the price of the WSM/USD market stays at $0.00070395, should the long-position pushers continue to execute more orders?
The hovering style market motions that the WSM/USD market has been exercising have been to allow buyers to stage a comeback steadily in the near term, as the crypto-economic market holds basis, hiking moves.
Buyers only need to have their positions on a long-term basis in the hopes of seeing significant bounce-offs over time. Technicalities have been used to give the market a significant dip-driven bargain session so that better buying entry may be made in the meantime.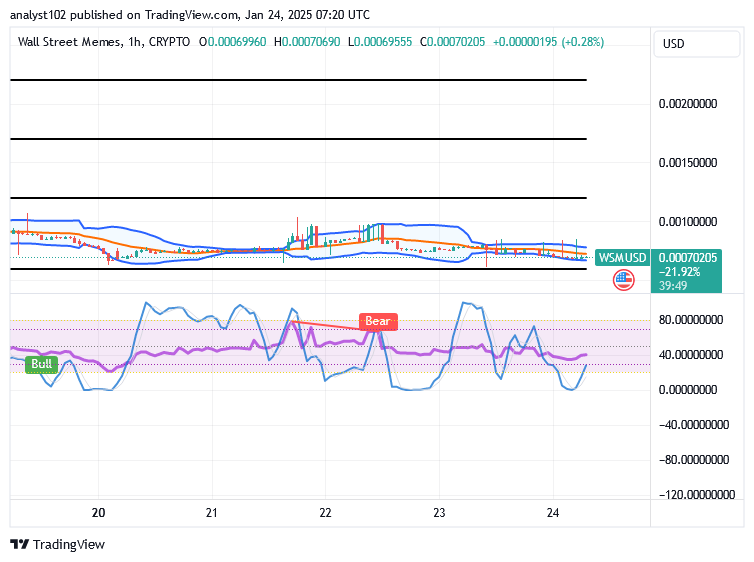
WSM/USD 1-hour chart
The 1-hour chart reveals that the WSM/USD market holds basis, hiking moves between the trend bounds of the indicators.
The stochastic oscillators have so far been able to veer south into the oversold area, suggesting that the sellers in the WSM/USD market have reached a significantly decreased zone that may signal the end of future drops. The Bollinger Bands indicators are positioned to show that the low-pushing pace setting is under pressure to support further losses.
Bitcoin has more above $100,000.
Leader: What’s stopping you from working?
Me:
Bitcoin holds over $100k
— Wall Street Memes (@wallstmemes) January 24, 2025
Boss: Why aren’t you doing any work?
Me: pic.twitter.com/SJrOlYVpy0
Buy and stake WSM now!: Wall Street Meme (WSM)