Top Trending Coins for Today, February 25: HT, BTC, SHIB, MATIC, And 1INCH
Estimated Reading Time: 4 minutes
Don’t invest unless you’re prepared to lose all the money you invest. This is a high-risk investment and you are unlikely to be protected if something goes wrong. Take 2 minutes to learn more
Across the top trending market for this week, we can see indecision, but towards the end of the week, the market began to slide to the downside. However, the buyers appear to be salvaging the market from a price decline.
Huobi Token (HT)
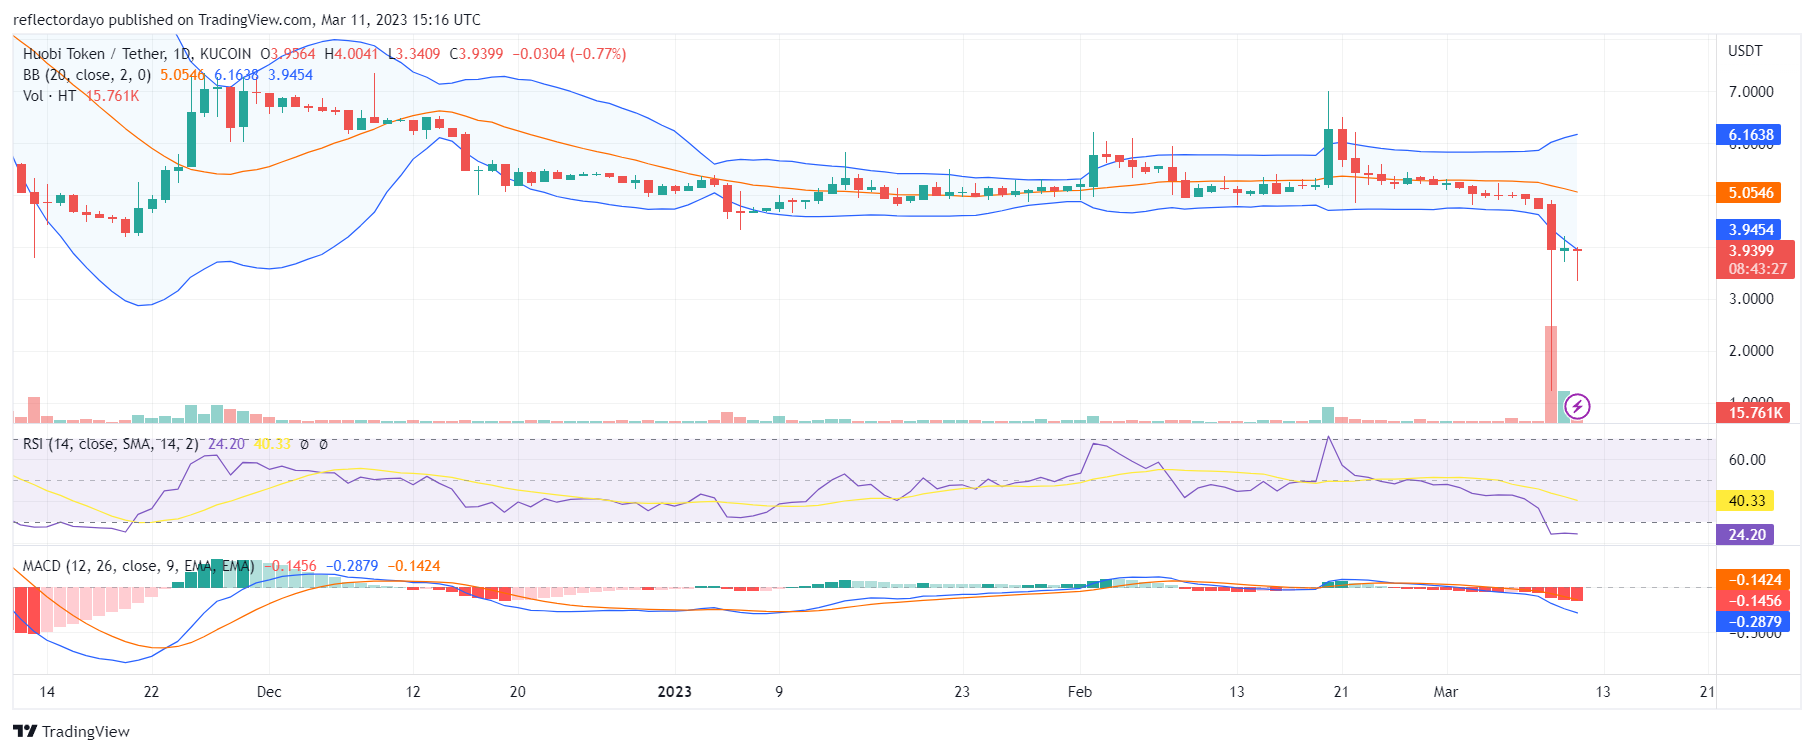
The price of the Huobi token has been maintained at around $5.3 since mid-December. However, the market had a few bullish spikes along the way, which later usually resulted in a slight price decline. From a broad view of the market, the volume of trade is low, and on each occasion that we see spikes in the bull market, we notice that the volume of trade does not commensurate with the outlook of the momentum candlestick on the chart. There is a lack of interest among traders in this market. Therefore, bulls could not defend their wins. Currently, the price has fallen to $3.9.
Current Price: $3.9355
Market Capitalization: $636,730,188
Trading Volume: $21,716,942
Bitcoin (BTC)
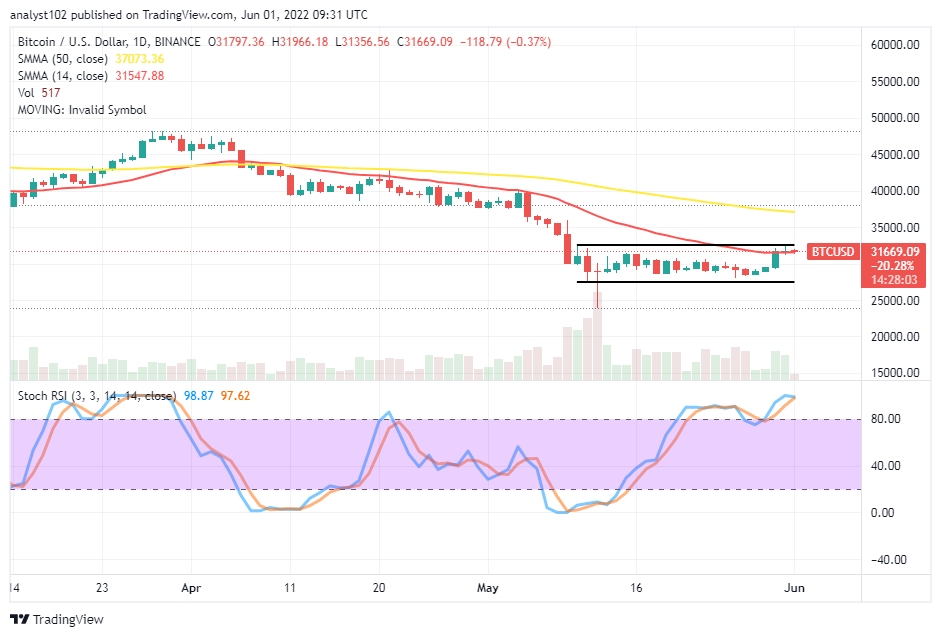
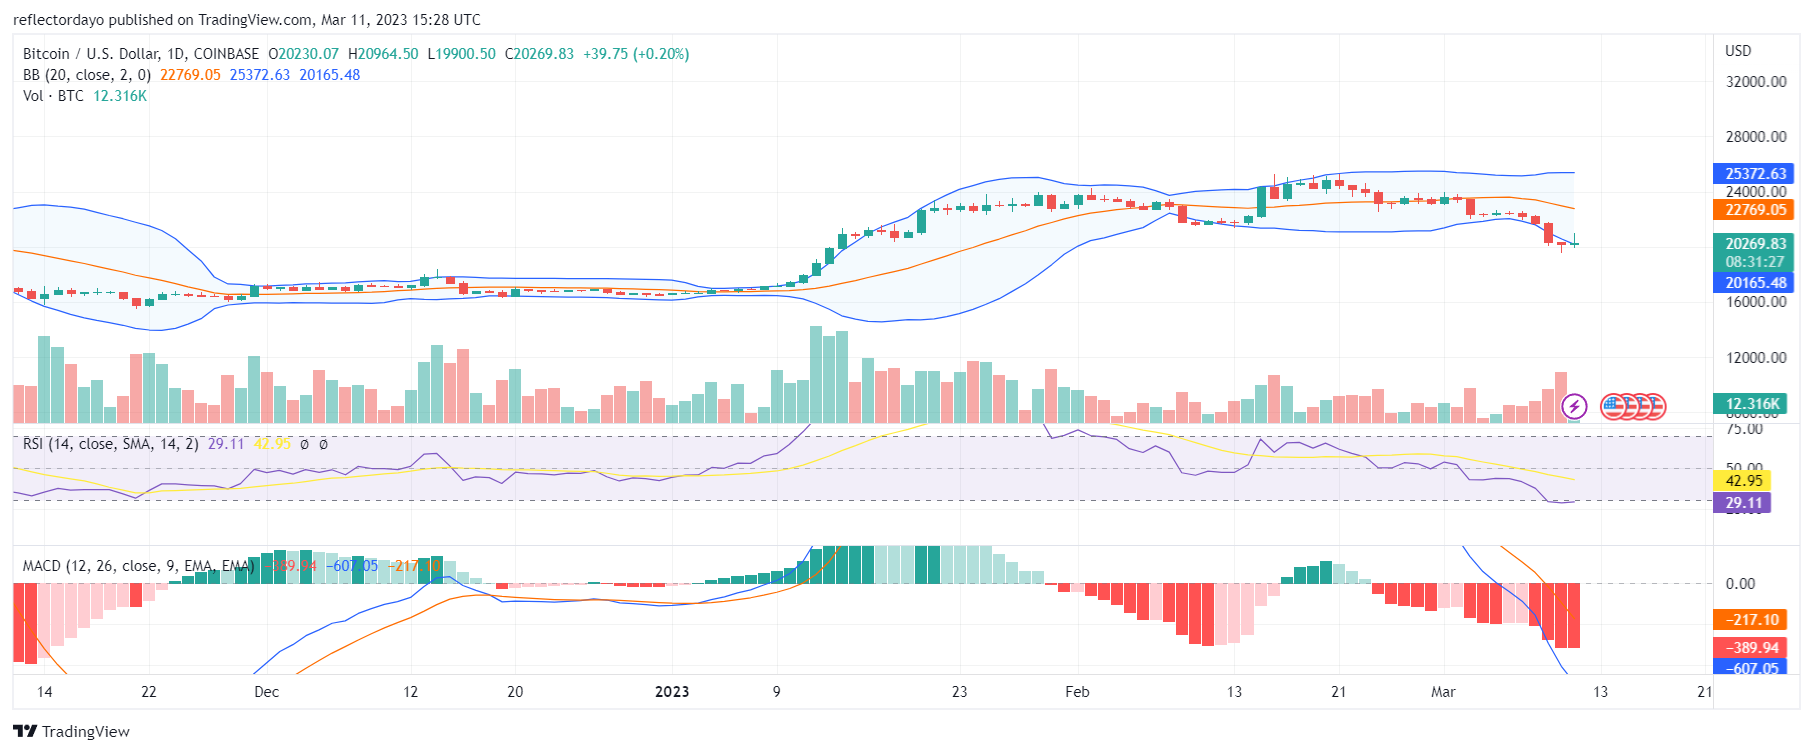
Bitcoin has continued to range sideways since late January, when the market reached the $24,000 price level. There has also been a spike on both sides of the market, but the price kept falling back to around the $24,000 level. However, towards the end of last week, a strong bearish move made the market drop to around the $22,000 price level. They maintain the market at this level until the price drops more. At the $20,000 price, traders seem to be willing to buy again. In today’s session, we noticed activities in the bull market. However, the low volume of trade has caused temporary indecision in today’s market.
Current Price: $20,284.57
Market Capitalization: $391,784,671,813
Trading Volume: $34,909,166,729
 Shiba Inu (SHIB)
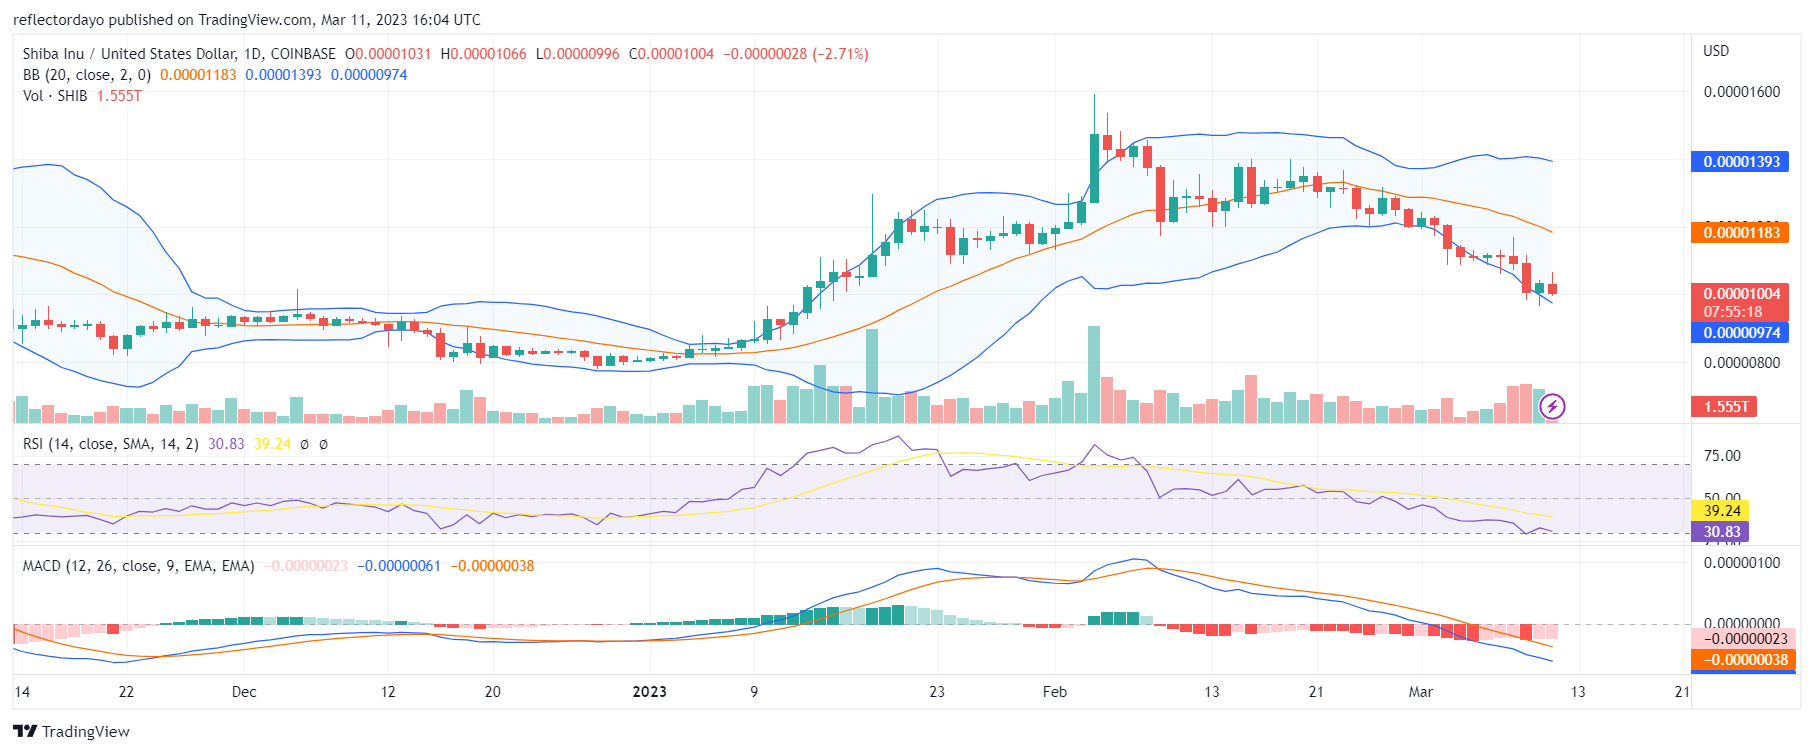
On February 4, the bull market became very ambitious as it tested the $0.0000159 price level. The bulls were still strong enough for the day to conserve the bullish price at $0.0000147. Unfortunately, this price level became the resistance level as the market fell below it. A lower resistance price level was formed at around $0.00001376. From February 9 till the end of the month, the market moves within the price zone created by the $0.000014 and $0.000012 price levels. The Relative Strength Index now carries a very strong bearish sentiment as the RSI line measures at the threshold of the oversold territory.
Current Price: $0.00001003
Market Capitalization: $5,552,066,704
Trading Volume: $289,864,660
Polygon (MATIC)
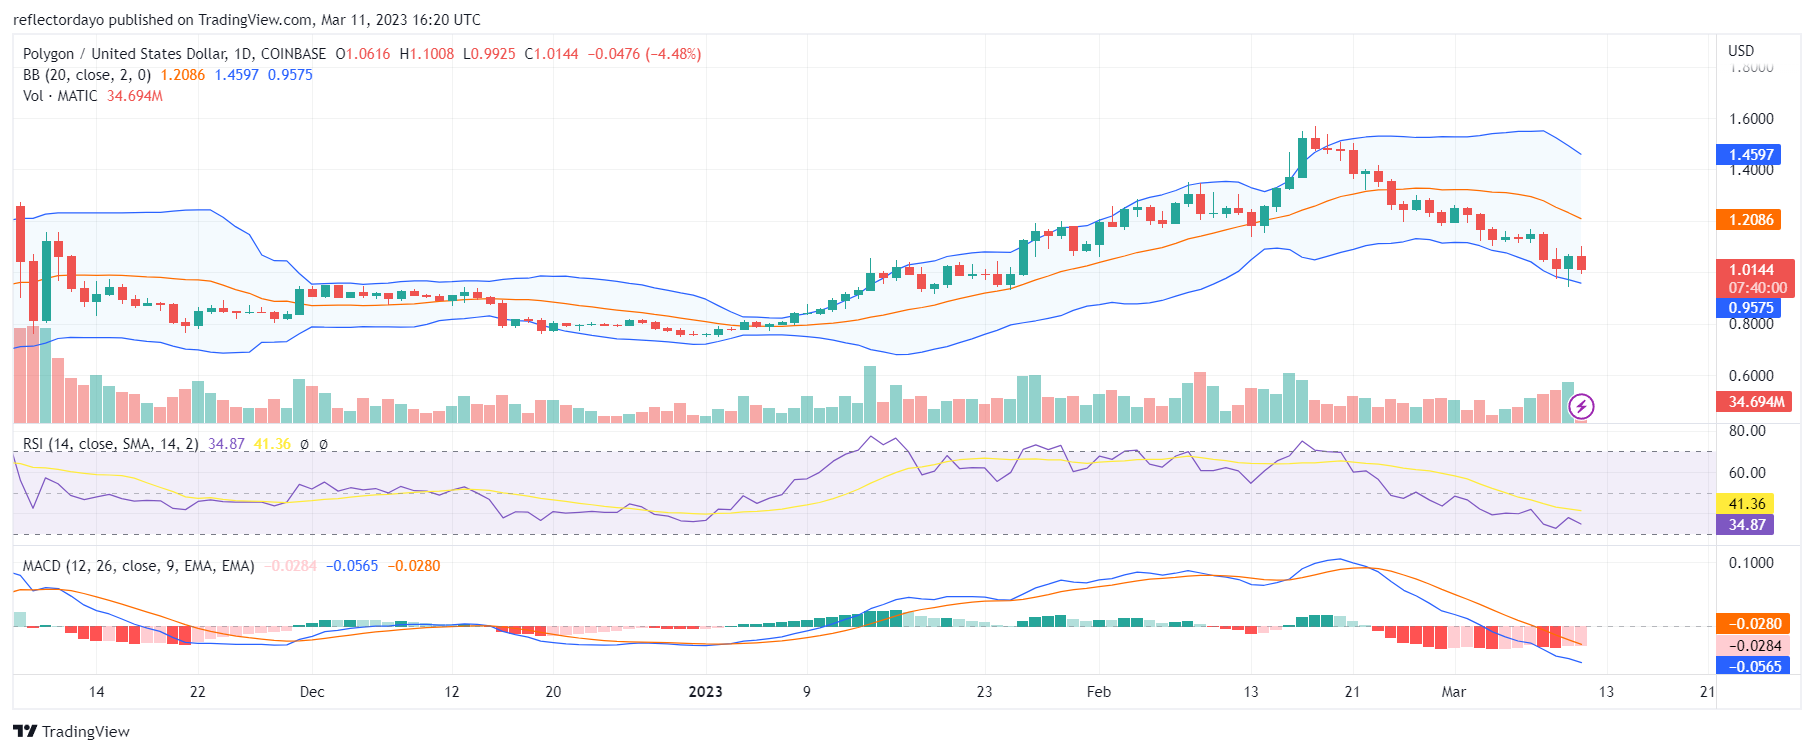
Polygon bear market took its base from the $1.52 price level, and with strong momentum, the price is being pushed further into bullish territory. The bear market encountered a bit of hindrance at the key support levels; bulls are not strong enough to stop the market. It is looking like the bears have reached their limit, as traders don’t seem to be willing to continue to sell at this level. Also, it looks like at this price, traders are willing to buy. Therefore, we should expect the market price to rally from this level.
Current Price: $1.017
Market Capitalization: $8,935,830,863
Trading Volume: $864,228,036
I Inch (1INCH)
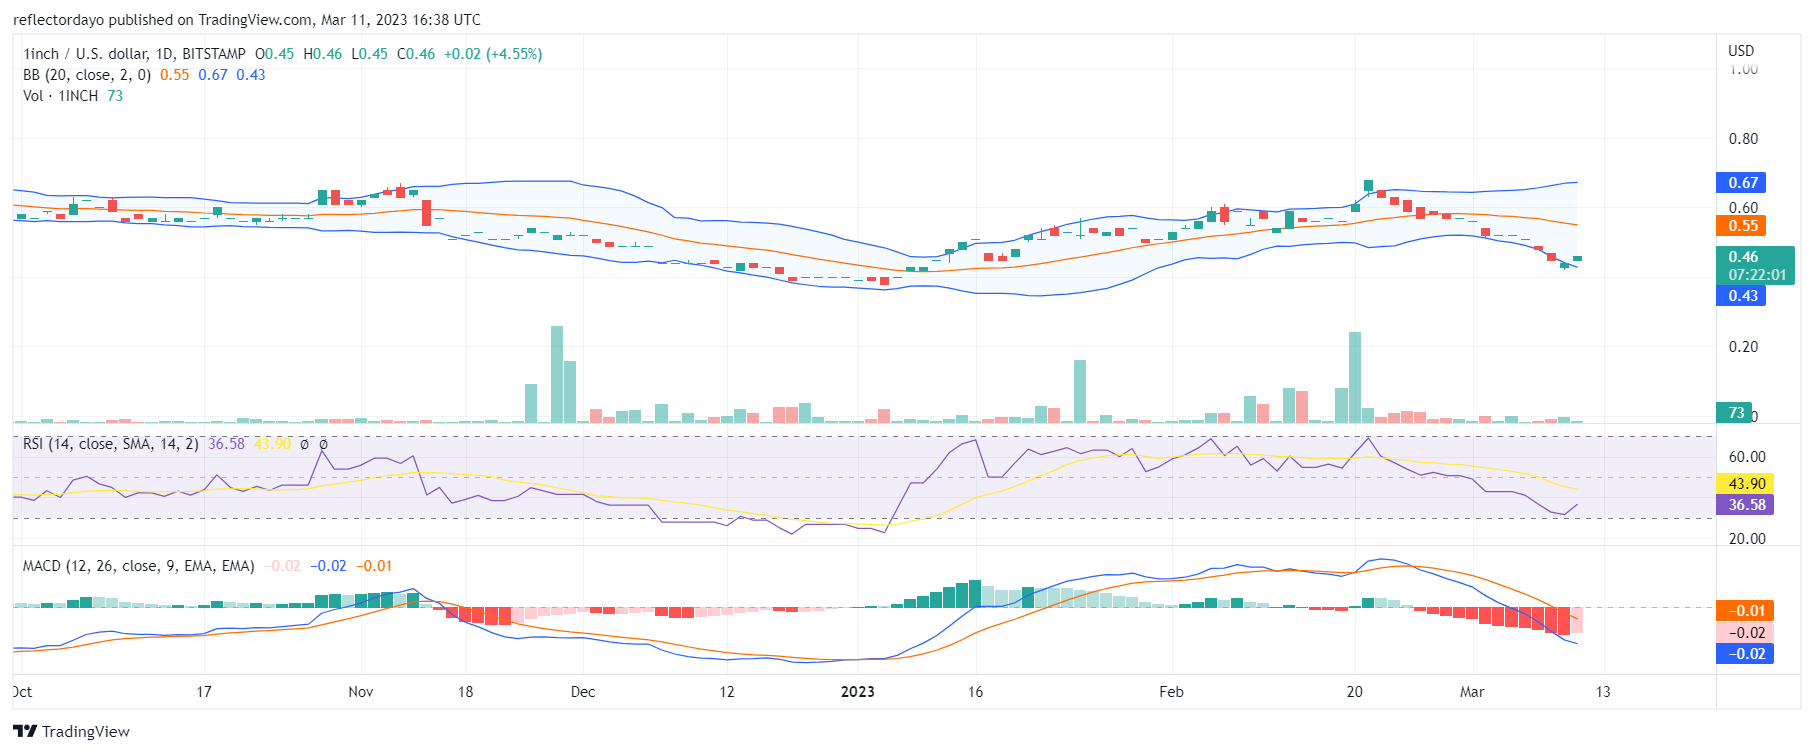
In the earlier part of the week, we noticed the appearance of 4-price Doji candlesticks representing the daily session on Sunday, Monday, and Tuesday. The market is at a high level of indecision. But between the midweek and the weekend, traders seem anxious to place trades, so the market goes the bearish way, but by the weekend, the bull market bounces back, bringing the price to $0.46. Though the volume of trade is low, we still notice the Bollinger Bands indicator portraying high volatility, this may be due to the low market capitalization.
Current Price: $0.46
Market Capitalization: $366,015,151
Trading Volume: $26,336,516
Would you like to advance your trading to a new level? Participate in Dash 2 Trade. Buy Dash 2 Trade (D2TUSD) now.