End of the Bearish Cycle for Synthetix (SNXUSD)?
Estimated Reading Time: 3 minutes
Don’t invest unless you’re prepared to lose all the money you invest. This is a high-risk investment and you are unlikely to be protected if something goes wrong. Take 2 minutes to learn more
Market Analysis – SNXUSD Is Likely at the End of Its Bearish Cycle
The end of the bearish cycle for SNXUSD is imminent. The market’s key levels have been very influential in determining the direction of prices. The year 2021 saw an increase in volatility in market movements.
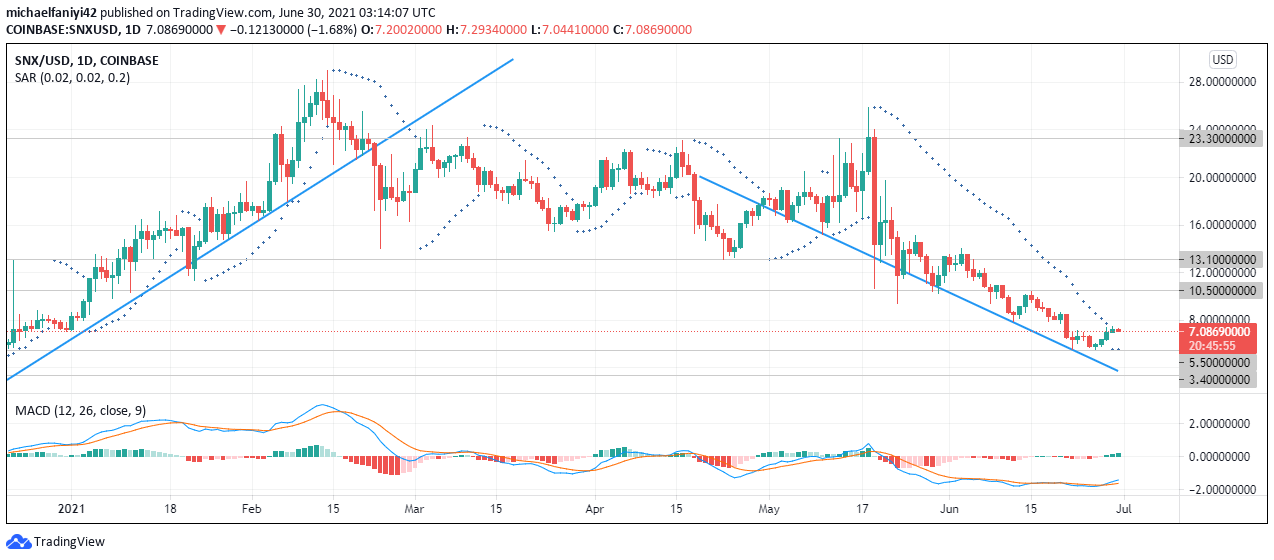
The coin climbed up steadily beginning from the 1st of January 2021 from $7.000 till it reached a price of $28.000 which is an all-time high on the 14th of February 2021. The market bulls had weakened by this point, and the price began a steady decline until it reached $13.100 demand. SNXUSD was thereafter locked in a consolidation phase between $13.100 demand and $23.300 supply. This consolidation phase lasted from late February to mid-May 2021.
The bears then took advantage of the increase in market volatility to plunge the coin out of the range to the next demand level at $10.500. The market gradually slid down afterward, bypassing the $10.500 demand. The market’s downtrend was, however, halted at the $5.500 demand level, which coincided with the descending trend line.
SNXUSD has now bounced off the $5.500 demand line upwards. The Parabolic SAR (Stop and Reverse) has displayed two dots below the daily candlesticks to affirm an imminent change in market direction. The MACD (Moving Average Convergence Divergence) has begun building bullish histogram bars and its signal lines have crossed each other facing upwards. Market prices appear to be on the verge of rising.
SNXUSD Key Zones
Supply: $13.100, $10.000
Demand: $5.500, 3.400

Market Prospects

On the 4-hour chart, several dots have been outlined under the candles by the Parabolic SAR, which shows a definite change to an upward momentum.
The MACD shows a bullish market with its signal lines having crossed the zero line. Its histogram bars are also currently bullish and large.
Except for a sudden increase in bearish pressure, SNXUSD is expected to continue its bullish drive and reach the $10.500 key level.
You can purchase crypto coins here. Buy Tokens
Note: Cryptosignal.org is not a financial advisor. Do your research before investing your funds in any financial asset or presented product or event. We are not responsible for your investing results.