Annual Forecast for Polkadot (DOT), 2022
Estimated Reading Time: 3 minutes
Don’t invest unless you’re prepared to lose all the money you invest. This is a high-risk investment and you are unlikely to be protected if something goes wrong. Take 2 minutes to learn more

Polkadot (DOT) Long-Term Analysis: Bearish
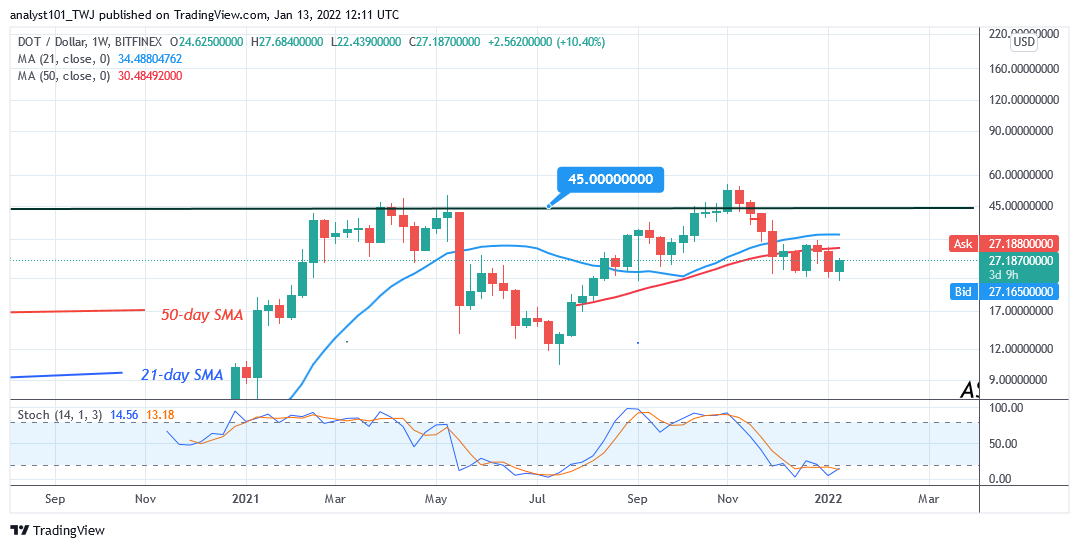
Polkadot’s (DOT) price is trading in the oversold region as buyers emerge. The downtrend appears to reach bearish exhaustion as the market reaches the oversold region. During the inception of the cryptocurrency, the DOT price was in an uptrend in 2021. On March 29, 2021, the altcoin rallied to a high of $46.74. Polkadot attained a peak price in the overbought region of the market.
The bulls could not sustain the bullish momentum above the overhead resistance. After much struggles in the overbought region, DOT/USD dropped sharply below the moving averages. The crypto dropped to the low of $11.75 as bulls bought the dips. Today, the bulls have broken above the $46 overhead resistance to reach a high of $55. However, the overbought condition of the crypto has made it to resume the downtrend.
Polkadot (DOT) Indicator Analysis
On a weekly chart, DOT price is below the 20% range of the daily stochastic. This explains that the selling pressure is likely to subside or end. It also explains that the market may probably hold above the $26 support. Buyers are likely to emerge in the oversold region to push prices upward. The 21-day SMA and the 50-day SMA are sloping sideways indicating the sideways trend. DOT price has been in a sideways trend after attaining the peak price.
Technical indicators:
Major Resistance Levels – $48, $52, $56
Major Support Levels – $32, $28, $24
Polkadot (DOT) Medium-term Trend: Bullish
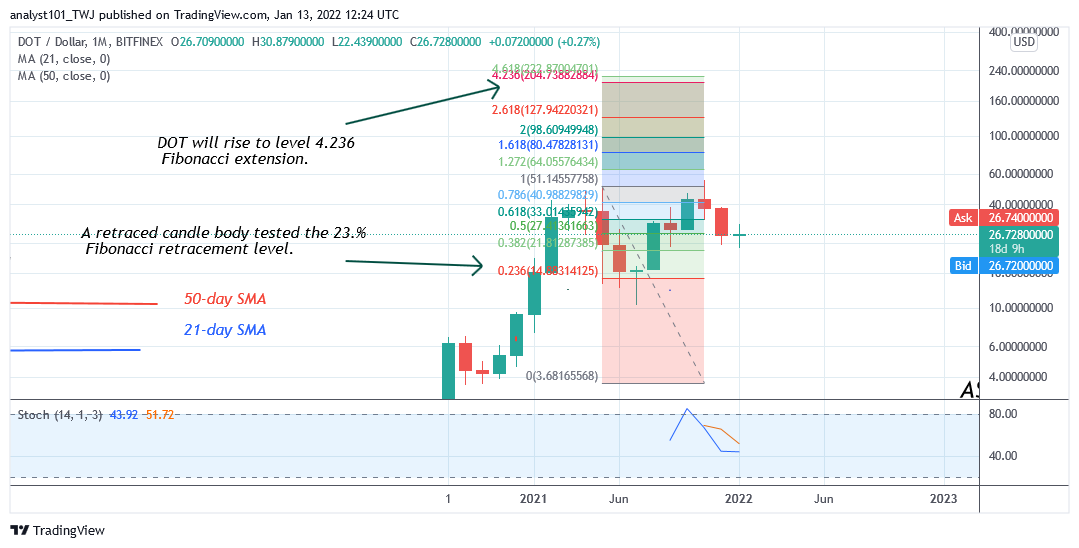
Polkadot is expected to resume up trending if price breaks the resistance at $55. Meanwhile, on May 1 uptrend; a retraced candle body tested the 23.6% Fibonacci retracement level. The retracement suggests that DOT will rise to level 4.236 Fibonacci extension or $204.73.
What Is the Next Direction for Polkadot (DOT)?
DOT/USD price has reached the oversold region of the market as buyers emerge. The downtrend is presumed to have ended as we expect buyers to emerge. The uptrend will resume if the price breaks above the $55.00 high. According to the Fibonacci tool analysis, Polkadot will rise to the high of $204.73 before the end of the year.
You can purchase crypto coins here. Buy Tokens
Note: Cryptosignals.org is not a financial advisor. Do your research before investing your funds in any financial asset or presented product or event. We are not responsible for your investing results