Polkadot Declines above $6.00 as It Poises To Bounce in a Range
Estimated Reading Time: 2 minutes
Don’t invest unless you’re prepared to lose all the money you invest. This is a high-risk investment and you are unlikely to be protected if something goes wrong. Take 2 minutes to learn more
Polkadot (DOT) Long-Term Analysis: Bullish
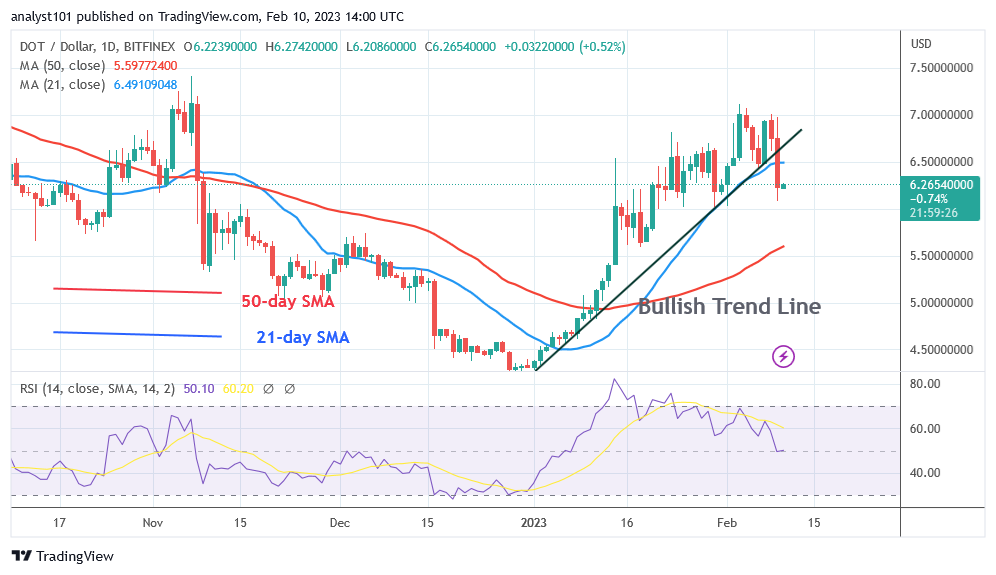
Polkadot (DOT) cost is dropping as it poises to bounce in a range. The current slump is probably going to get worse. The DOT price fell to its previous low of $6.00 as the price of the cryptocurrency sank beneath the moving average lines. Currently, the moving average lines are being traded by Polkadot. In other words, the cryptocurrency is above the 50-day SMA but below the 21-day SMA. The inference states that DOT/USD will have to bounce between the moving average lines. In the event that the moving average lines are broken, the cryptocurrency will trend again.
Polkadot (DOT) Indicator Analysis
On the Relative Strength Index, Polkadot is at level 49 for period 14. The downtrend zone for the altcoin is getting closer. Between supply and demand, there is now a balance. The fact that the price bars are situated between the moving average lines suggests that the cryptocurrency may move in a range. Below the daily Stochastic’s threshold 20, the altcoin is experiencing a bearish momentum.
Technical indicators:
Major Resistance Levels – $10, $12, $14
Major Support Levels – $8, $6, $4
What Is the Next Direction for Polkadot (DOT)?
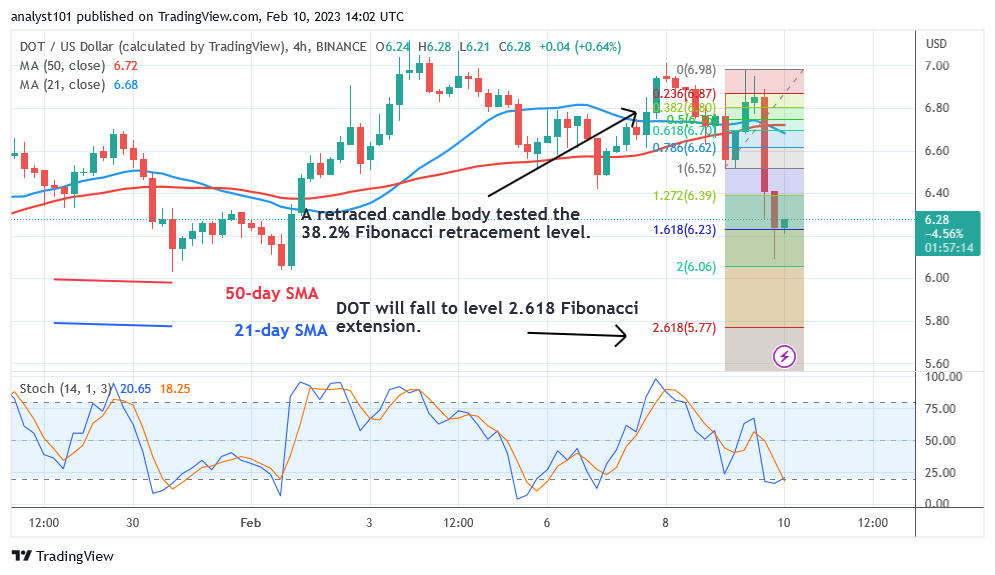
Polkadot is getting close to the area of the negative trend as it poises to bounce in a range. Bearish weariness has been reached in the present slide. The oversold area has been reached by the DOT price. The DOT price reversed upward during the downturn of February 9 and a candle body tested the 38.2% Fibonacci retracement level. According to the correction, DOT will drop to level 2.618 of the Fibonacci extension, or $5.77.
You can purchase Lucky Block here: Buy LBLOCK
Note: Cryptosignals.org is not a 1a financial advisor. Do your research before investing your funds in any financial asset or presented product or event. We are not responsible for your investing results