Polkadot Retraces as It Targets the Next Barrier Level of $7.50
Estimated Reading Time: 2 minutes
Don’t invest unless you’re prepared to lose all the money you invest. This is a high-risk investment and you are unlikely to be protected if something goes wrong. Take 2 minutes to learn more
Polkadot (DOT) Long-Term Analysis: Bullish
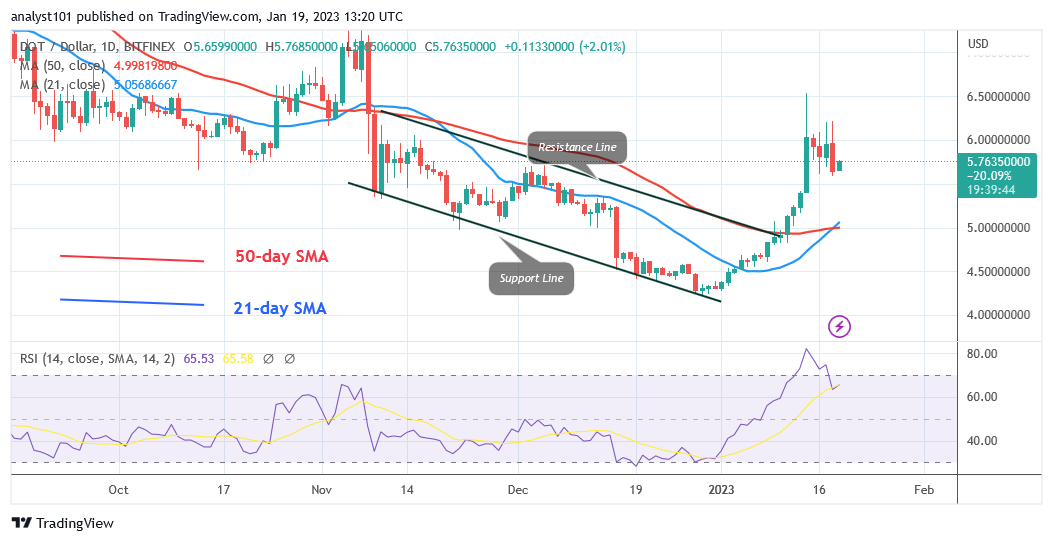
Polkadot’s (DOT) price has broken above the moving average lines as it targets the next barrier level of $7.50. The cryptocurrency asset increased in value from its lowest point of $4.25 to its peak of $6.53. As the market reached an overbought area at $6.53, the present bullish momentum has been stopped. Polkadot is currently trading below the $6.00 barrier level. Since November 9, the resistance level has not been broken. On the downside, the positive momentum will pick back up if the altcoin retraces above the $5.00 breakout mark or the moving average lines. However, if the selling pressure continues, Polkadot will retest the prior low at $4.25.
Polkadot (DOT) Indicator Analysis
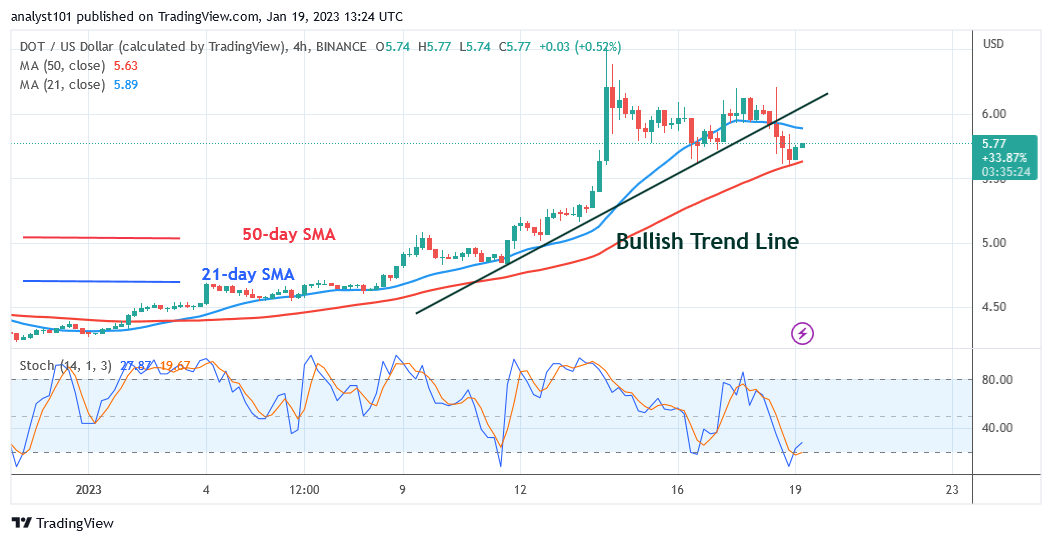
The altcoin has retraced to level 65 on the 14-period Relative Strength Index. As it is in the bullish trend zone, the price of DOT will increase. The market will increase in the same way as the price bars rise above the moving average lines. At the moment, Polkadot is moving upward over the daily Stochastic’s level 30.
Technical indicators:
Major Resistance Levels – $10, $12, $14
Major Support Levels – $8, $6, $4
What Is the Next Direction for Polkadot (DOT)?
DOT/USD has decreased below the 21-day line SMA but above the 50-day line SMA as it targets the next barrier level $7.50. For a few days, the currency is anticipated to remain trapped between the moving average lines. When the moving average lines are broken, Polkadot will trend.
You can purchase crypto coins here. Buy LBLOCK
Note: Cryptosignals.org is not a 1a financial advisor. Do your research before investing your funds in any financial asset or presented product or event. We are not responsible for your investing results