Polkadot (DOT/USD) Targets $5.227 Potential Breakout While Consolidating
Estimated Reading Time: 3 minutes
Don’t invest unless you’re prepared to lose all the money you invest. This is a high-risk investment and you are unlikely to be protected if something goes wrong. Take 2 minutes to learn more
Polkadot Long-term Analysis: Bearish
Polkadot (DOT) against the United States Dollar (USD) has been on a prolonged downtrend since the middle of 2023 till early 2024. The price of the pair has been on a downtrend with a brief ranging period in 2024.
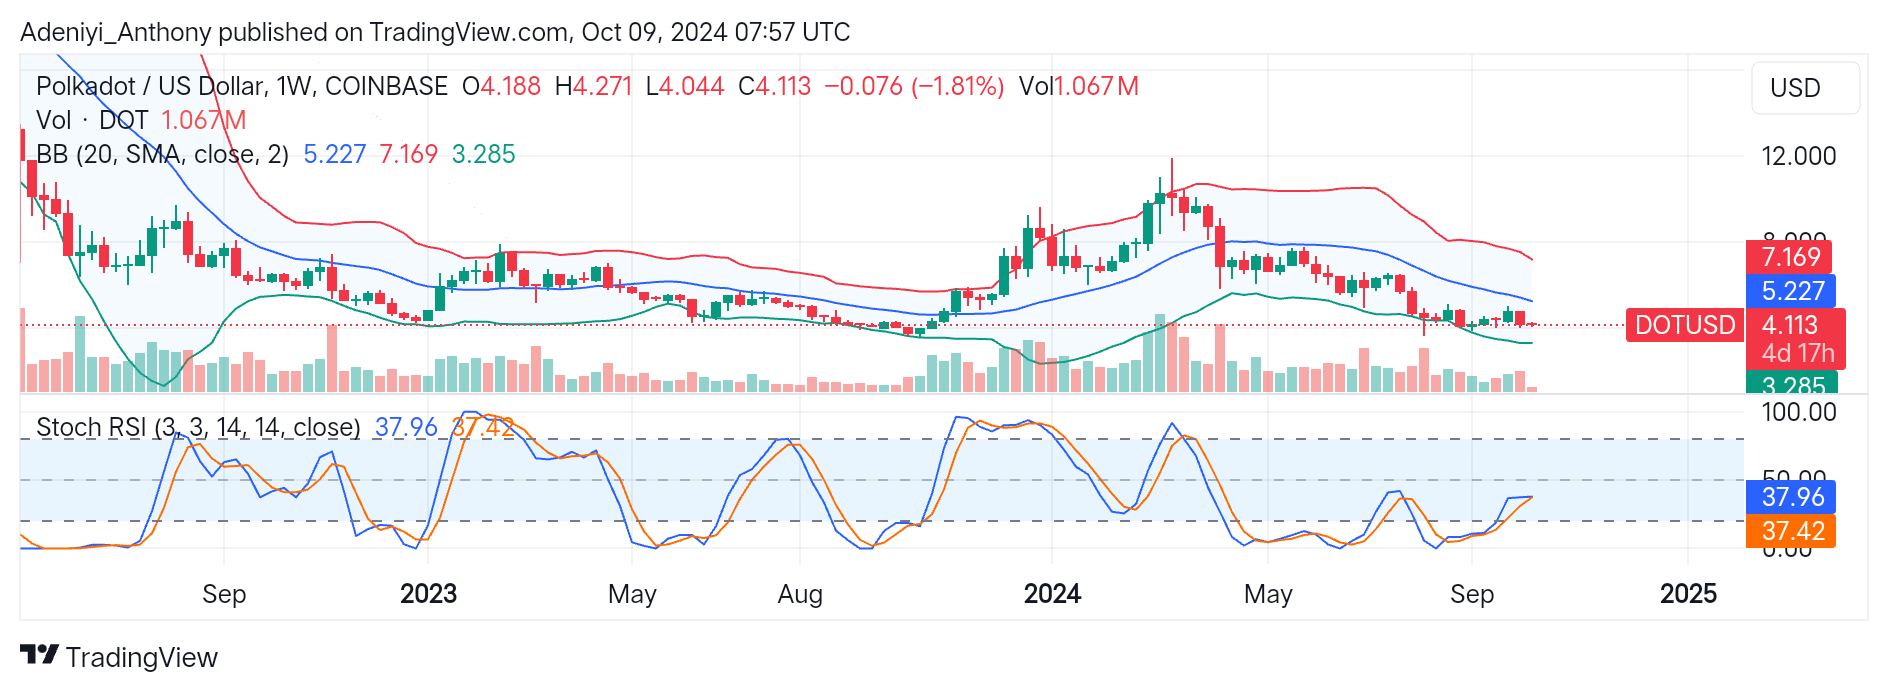
In past weeks, the price of DOT/USD has been fluctuating between the lower and middle Bollinger bands at $3.285 and $5.227. The closeness of the bands suggests and the directional formation of the candlesticks reflects the presence of bearish pressure in the market.
However, a break above the middle band at $5.227 would indicate a potential trend reversal. Conversely, a break below the immediate dynamic level at $3285 would signal a further decline and the continuation of the downtrend.
Polkadot is currently trading at $4.113.
Technical Indicators
Major Resistance Levels: $5.227, $7.170, and $8.000
Major Support Levels: $3.285, $3.000, and $2.500
Polkadot Technical Indicator Analysis
Polkadot against the Dollar has been on an extensive downtrend. However, the recent price activities between the compressed lower region of the Bollinger bands suggest low volatility. Currently, the price is trending below the middle band, though showing bearish dominance, but there is a possibility of a trend reversal if the price slices through the $5.227 level.
On the other hand, the Stochastic Relative Strength Index displays the pair in a neutral region with a slight upward direction.This indicates some bullish momentum is building. For now, the market is trending downward until stronger bullish strength comes into play.
Polkadot (DOT/USD): is an Uptrend Even Possible?
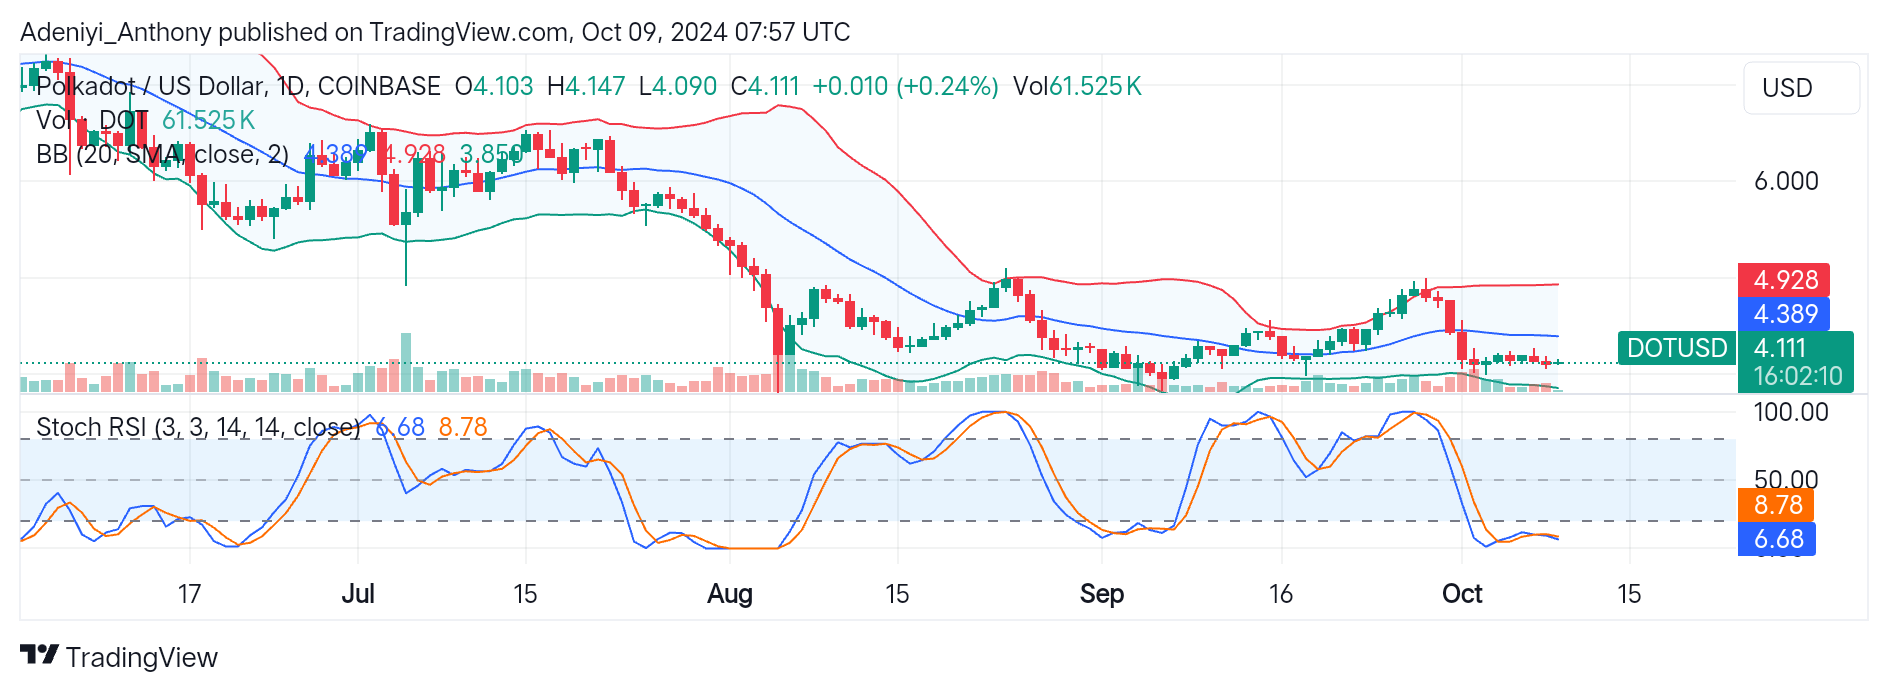
DOT/USD on the daily chart is trading at $4.111 with a slight price change between the $4.090 and $4.147 levels. The close of the Bollinger band in this timeframe suggests declined volatility and potential breakout or breakdown. With the price of the pair around the prescribed oversold region of the indicator, the chance of a rebound to the upside is possible.
On the downside of the chart, the Stochastic RSI indicates the pair is operating in the deep oversold region. This gives the sign for a potential rebound. Furthermore, these indicators may be signaling a downtrend, but a break below the lower band at $3.85 and not above the middle band at $4.389 would lead to continued downtrend. Therefore, traders should watch out for these key levels.
You can purchase crypto coins here. Buy LBlock