$SPONGE (SPONGE/USD): Bulls Fight Back at Support – Reversal on Horizon?
Estimated Reading Time: 3 minutes
Don’t invest unless you’re prepared to lose all the money you invest. This is a high-risk investment and you are unlikely to be protected if something goes wrong. Take 2 minutes to learn more

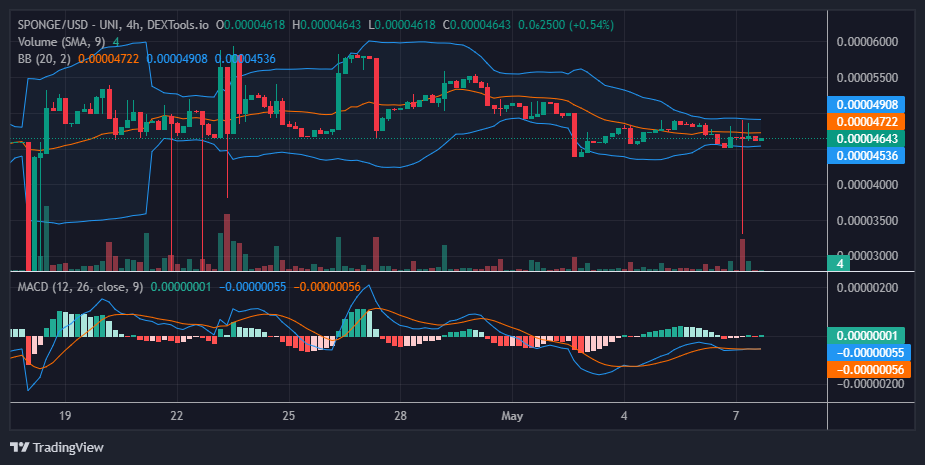
The $SPONGE market has been locked in a tense standoff around the crucial support level of $0.000045. This follows a bullish spike that peaked at $0.00006 and led to the trigging of a bearish trend on April 27. This relentless downtrend has threatened to breach this critical line. However, unwavering bullish sentiment at this price point has created a resistance that’s holding back the bears. This tug-of-war suggests a potential return to an upward trajectory, but the fight is still ongoing.
Key Market Dynamics:
- Resistance Levels: $0.0010, $0.0011, and $0.0012.
- Support Levels: $0.000035, $0.000030, and $0.000025.
Delving into Technical Analysis for $SPONGE (SPONGE/USD)
The initial trading session today opened near $0.00004635, marked by indecision. The following session, however, saw a surge in activity, but neither bulls nor bears could claim dominance. A telling sign emerged: a dragonfly candlestick with a long lower shadow, hinting at bullish forces defending the $0.000045 level.
This extended shadow suggests two possibilities: exhaustion on both sides, potentially leading to a sharper move (up or down) if support breaks. Alternatively, it could signal accumulation by buyers anticipating a price rise. The historical significance of the $0.000045 support further bolsters the case against a breakdown.
The dragonfly pattern hints that the downtrend might be losing steam, potentially paving the way for a bullish reversal. However, confirmation of this reversal awaits further price action.
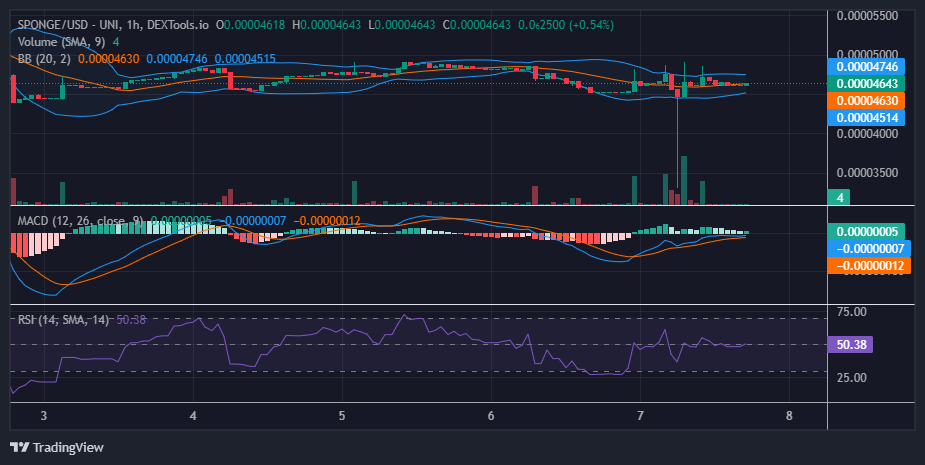
Insights from the 1-Hour Perspective:
The appearance of a dragonfly doji candlestick on the 1-hour chart is a noteworthy development in the $SPONGE market. This pattern often signals a potential reversal, suggesting that bullish momentum might be building.
The Moving Average Convergence and Divergence (MACD) indicator from this timeframe suggests a shift from negative to positive territory, hinting at a potential bullish bias. However, Bollinger Bands and RSI paint a picture of continued sideways movement. This conflicting data suggests the market might remain range-bound for a bit longer. But as bulls have begun building up momentum at $0.000045, the consolidation phase may not take too long.
Buy SPONGE/USD!
NEVER FORGET 🧽💦💦💦$SPONGE #SpongeV2 #AltSeason pic.twitter.com/US6VmS56Fa
— $SPONGE (@spongeoneth) May 7, 2024
Invest in the hottest and best meme coin. Buy Sponge ($SPONGE) today!