Polkadot Fluctuates Above $6.80 Support as Demand Dries up at a Recent High
Estimated Reading Time: 2 minutes
Don’t invest unless you’re prepared to lose all the money you invest. This is a high-risk investment and you are unlikely to be protected if something goes wrong. Take 2 minutes to learn more

Free Crypto Signals Channel
Polkadot (DOT) Long-Term Analysis: Bearish
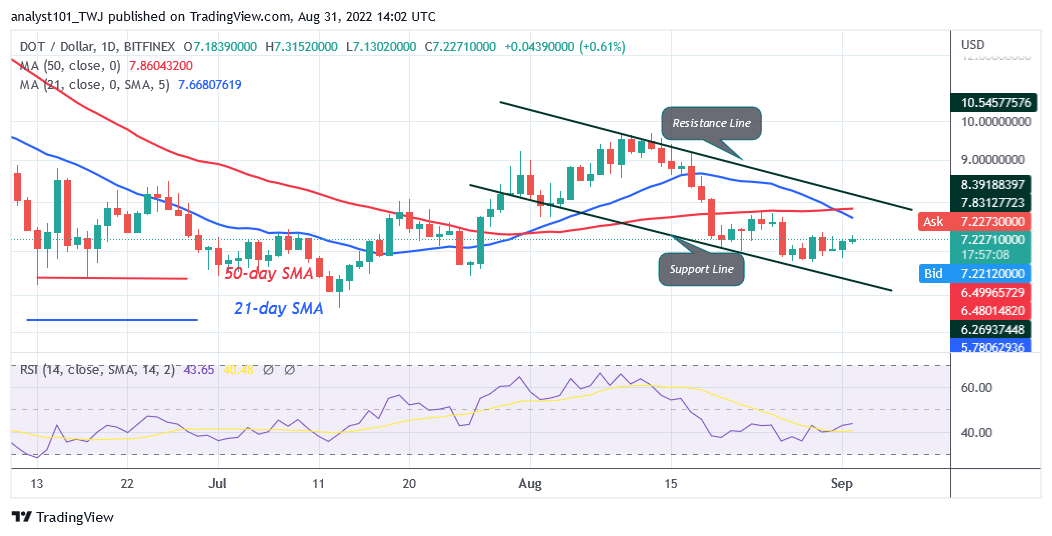
Polkadot’s (DOT) price is in a downtrend as demand dries up at a recent high.Since August 26, the cryptocurrency has been fluctuating between $6.80 and $7.50 price levels. On the upside, if buyers break above the resistance at $7.50, Polkadot will rise and revisit the $9.68 overhead resistance. On the downside, if sellers break below the $6.80 support, the selling pressure will resume. The altcoin will further decline to the previous lows at $6.52 and $5.98 price levels. In the meantime, Polkadot is trading at a level $7.22 at the time of writing.
Polkadot (DOT) Indicator Analysis
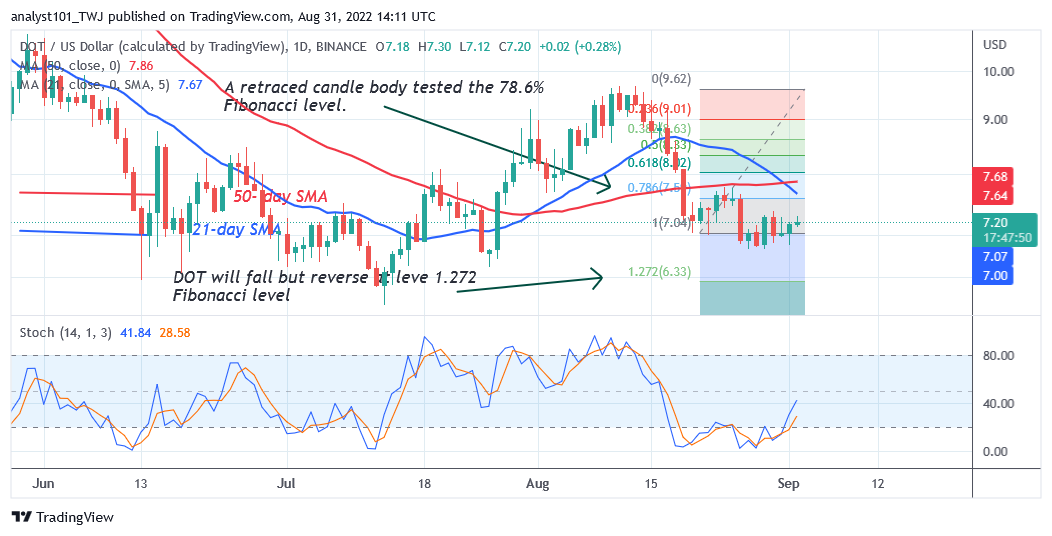
The altcoin is at level 43 of the Relative Strength Index for period 14. The crypto’s price is in a downtrend trend zone and may further decline.DOT price bars are below the moving average lines which indicates further decline. The altcoin price is above the 40% range of the daily stochastic. The market is in a bullish momentum.
Technical indicators:
Major Resistance Levels – $10, $12, $14
Major Support Levels – $8, $6, $4
What Is the Next Direction for Polkadot (DOT)?
Polkadot is in a downward correction as demand dries up at a recent high. Buyers are emerging in the oversold region to push prices upward. Meanwhile, on August 21 downtrend, a retraced candle body tested the 78.6% Fibonacci retrenchment level. The retracement suggests that DOT/USD will fall to level 1.272 Fibonacci extension or level $6.33. From the price action, the DOT price is fluctuating above the $6.80 support.
You can purchase crypto coins here. Buy LBLOCK
Note: Cryptosignals.org is not a 1a financial advisor. Do your research before investing your funds in any financial asset or presented product or event. We are not responsible for your investing results