Polkadot Is Falling as It Battles to Stay above $5.00
Estimated Reading Time: 2 minutes
Don’t invest unless you’re prepared to lose all the money you invest. This is a high-risk investment and you are unlikely to be protected if something goes wrong. Take 2 minutes to learn more
Polkadot (DOT) Long-Term Analysis: Bullish
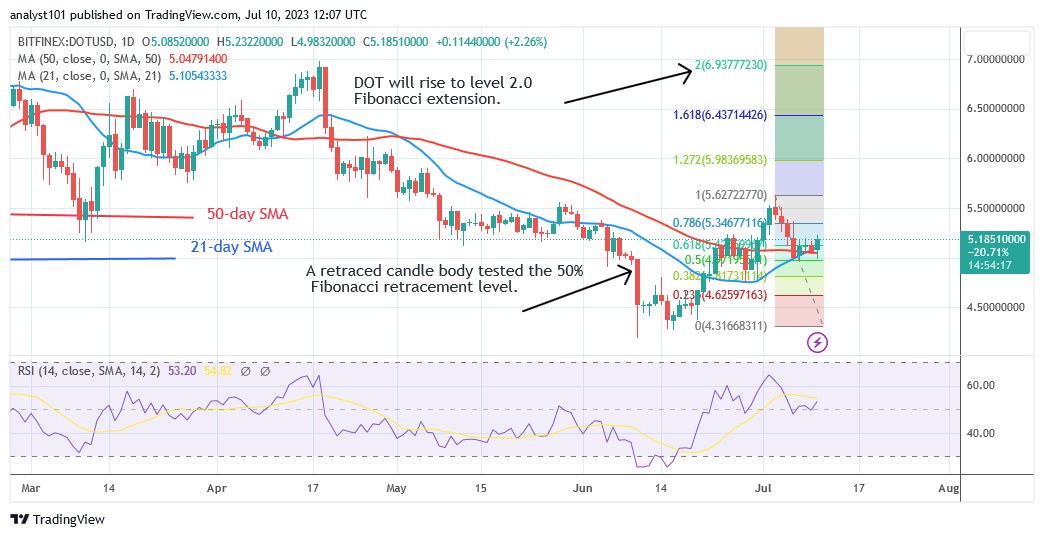
Polkadot (DOT) is trading above the bullish trend zone as it battles to stay above $5.00. The uptrend that began on July 3 was broken when the altcoin fell above the moving average lines. The current downturn has begun to level off above the moving average lines. If the price of the cryptocurrency rises over the moving average lines, the uptrend will restart.
The DOT price increased to a high of $7.00. However, if the price of the cryptocurrency falls below the moving average lines, the downturn will resume. The market will drop to $4.50, its previous low. Meanwhile, the cryptocurrency’s price is fighting to stay above the moving average lines.
Technical indicators:
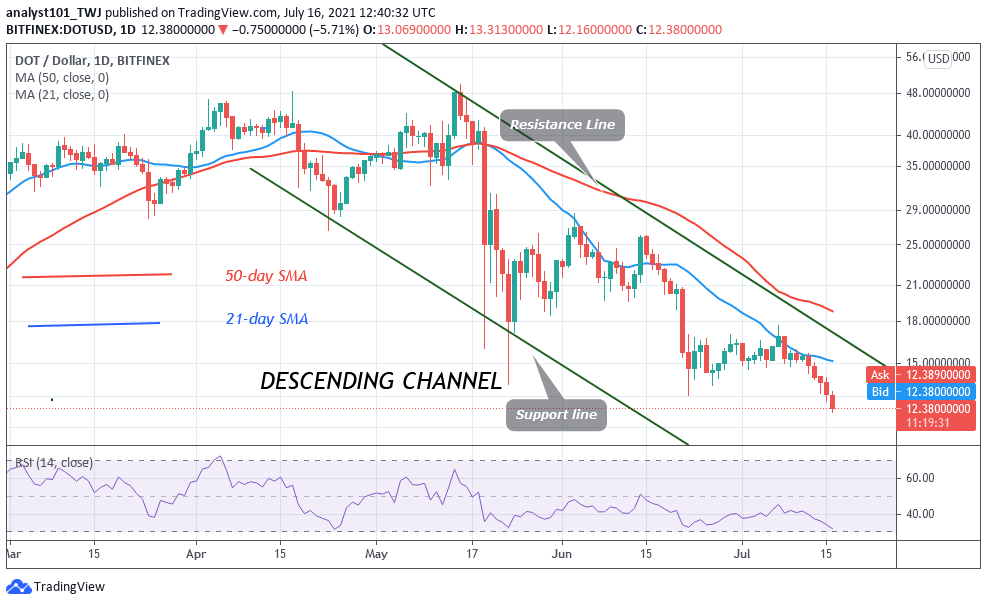
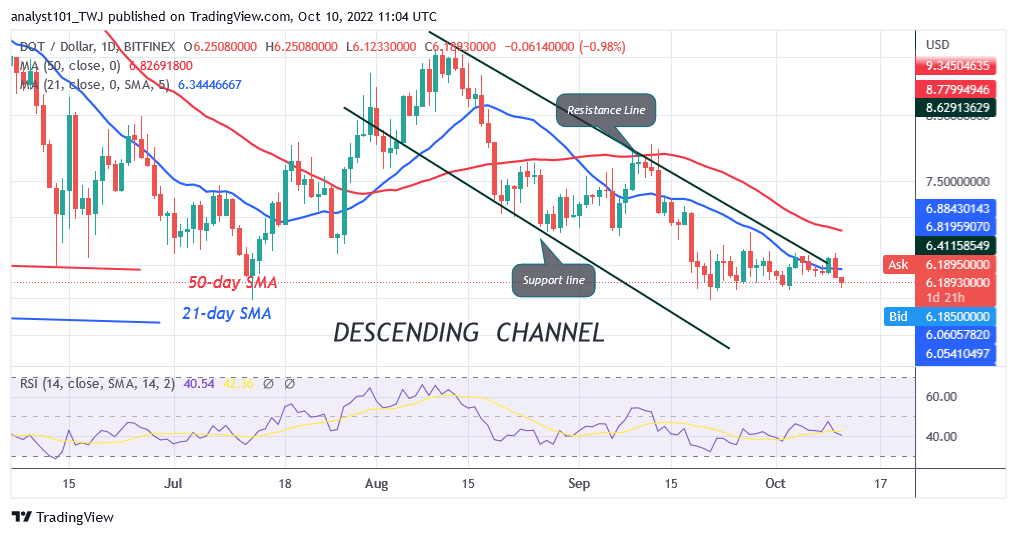
Major Resistance Levels – $10, $12, $14
Major Support Levels – $8, $6, $4
Polkadot (DOT) Indicator Analysis
The crypto asset is at level 51 on the Relative Strength Index for period 14. Polkadot has thus attained its equilibrium price level. That is, demand and supply have achieved a point of equilibrium. If the price bars maintain above the moving average lines, the altcoin will climb.
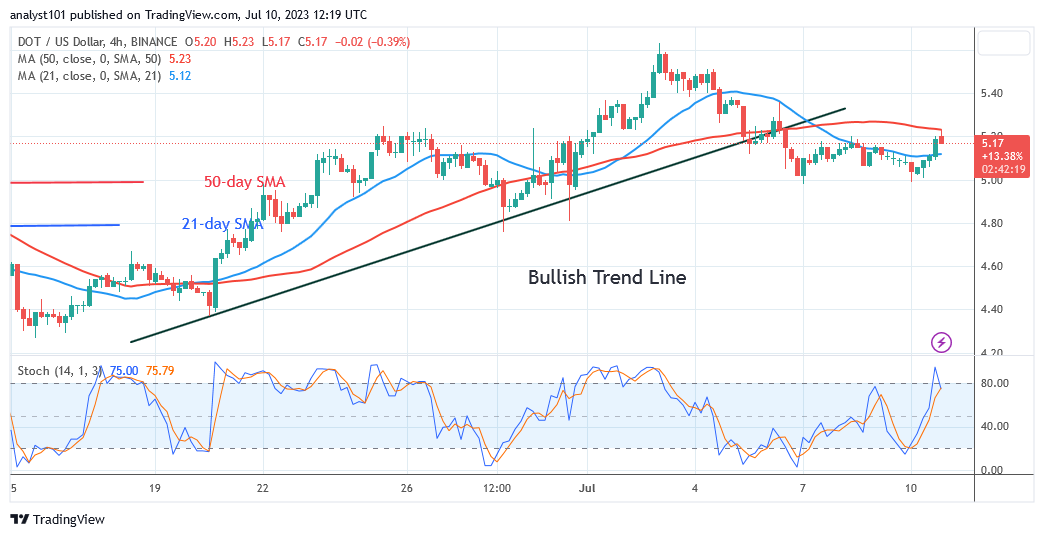
The altcoin is in a negative trend below the daily Stochastic threshold of 80.
What Is the Next Direction for Polkadot (DOT)
Polkadot is resuming an uptrend as it battles to stay above $5.00. The cryptocurrency price will continue to rise if it continues above the moving average lines.The cryptocurrency will plummet if the bears’ breach below the moving average lines.
You can purchase Lucky Block here. Buy LBLOCK
Note: Cryptosignals.org is not a financial advisor. Do your research before investing your funds in any financial asset or presented product or event. We are not responsible for your investing results