Polkadot Risks Decline as It Turns Down From $6.40 High
Estimated Reading Time: 3 minutes
Don’t invest unless you’re prepared to lose all the money you invest. This is a high-risk investment and you are unlikely to be protected if something goes wrong. Take 2 minutes to learn more
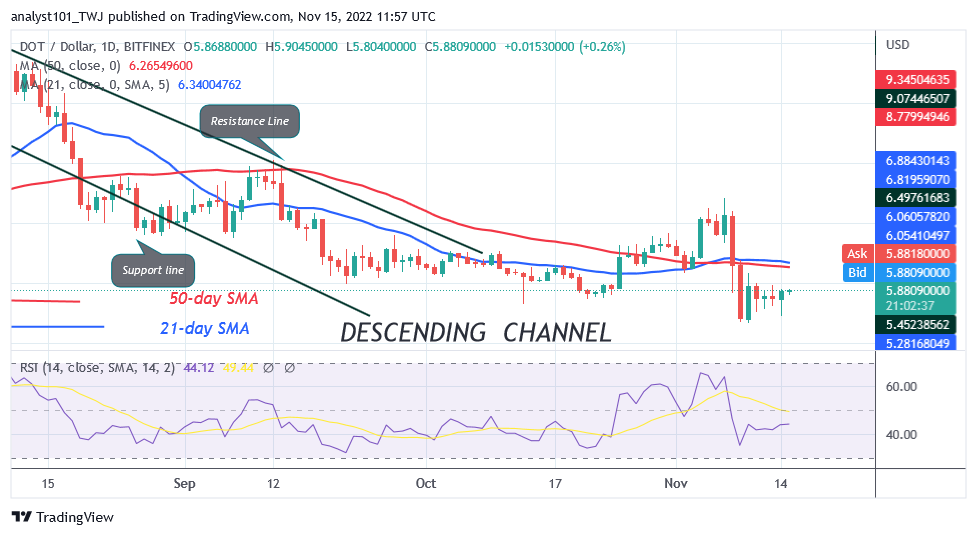
Polkadot (DOT) Long-Term Analysis: Bearish
Polkadot (DOT) price fluctuates below the moving average lines as it turns down from $6.40 high. Following the price drop on November 9, the cryptocurrency has been oscillating below the moving average lines. The altcoin fell to a low of $5.34 on November 9. The DOT pricing has been ranging between $5.30 and $6.40 for the past week. If the bears manage to break through the current support, the altcoin’s price will drop, even more, reaching a low of $4.89 or $5.00. If buyers manage to overcome the resistance at $6.40, Polkadot will resume upward. In other words, if purchasers maintain the price above the moving average lines, the DOT price will rise.
Polkadot (DOT) Indicator Analysis
For period 14, the DOT price is at level 44 on the Relative Strength Index. The altcoin is in a downtrend area and could drop further. If the price bars fall below the moving average lines, the value of the cryptocurrency may decrease. The daily Stochastic for the altcoin is above level 25. It indicates a bullish momentum for Polkadot.
Technical indicators: Major Resistance Levels – $10, $12, $14 Major Support Levels – $8, $6, $4
Read Also Our Crypto Prediction Guides:
- Big Eyes Coin Price Prediction 2023, 2024, 2025, 2030
- Will Shiba INU Reach 1 Cent 2023? SHIB Price Prediction
- Is Shiba inu (SHIB) Dead? – 2023
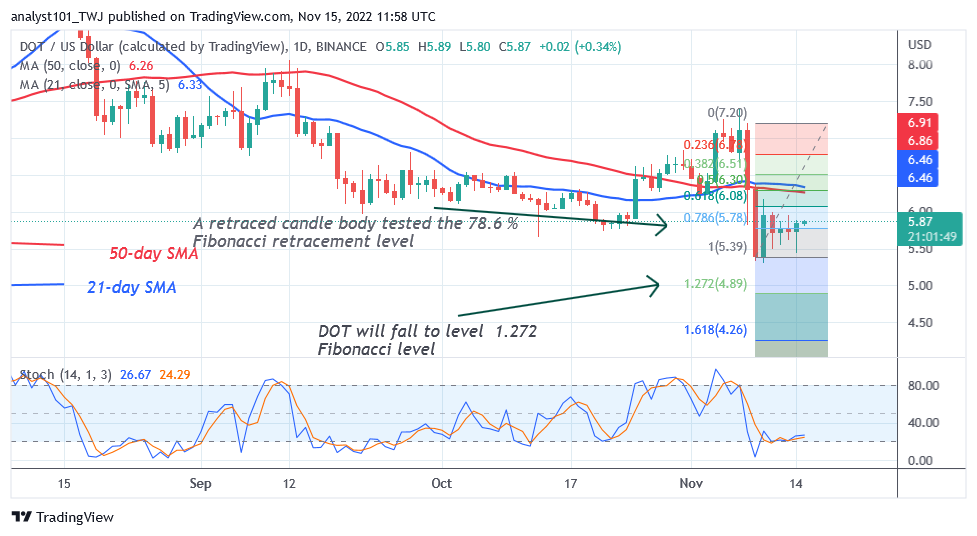
What Is the Next Direction for Polkadot (DOT)?
Polkadot is encountering rejection as it turns down from $6.40 high. As purchasers struggle to keep the price above the moving average lines, the altcoin has recently started to fall from them. The DOT price reversed upward during the downturn on November 9 and a candle body tested the 78.6% Fibonacci retracement level. The correction predicts that the cost of DOT will decrease to level 1.272 in the Fibonacci sequence, or $4.89.
You can purchase crypto coins here. Buy LBLOCK
Note: Cryptosignals.org is not a 1a financial advisor. Do your research before investing your funds in any financial asset or presented product or event. We are not responsible for your investing results