Polkadot Is in a Range as It Challenges the Resistance at $4.40
Don’t invest unless you’re prepared to lose all the money you invest. This is a high-risk investment and you are unlikely to be protected if something goes wrong. Take 2 minutes to learn more

Polkadot (DOT) Long-Term Analysis: Bullish
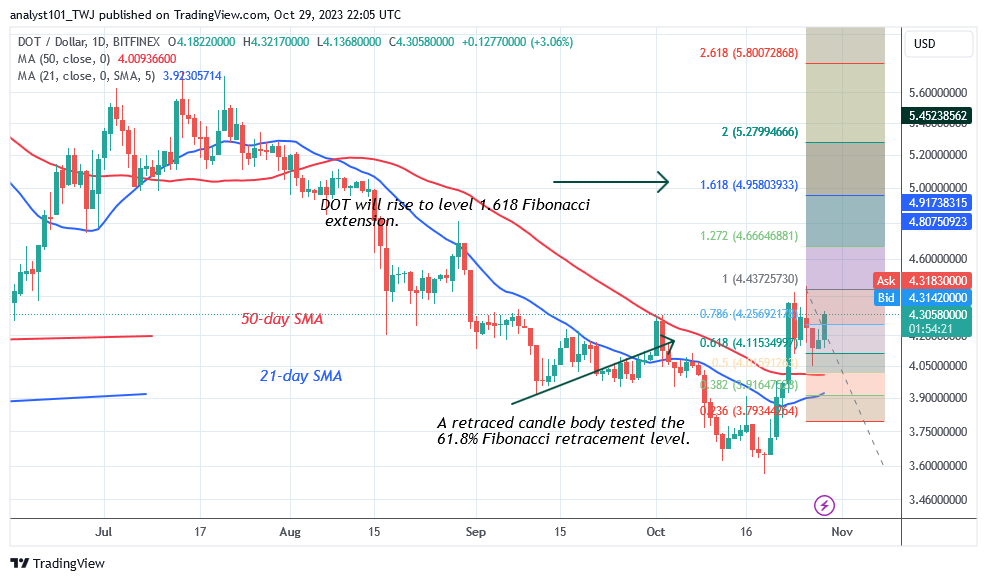
Polkadot (DOT)’s bullish trend has remained above the moving average lines as it challenges the resistance at $4.40. However, the rising trend has been stifled by resistance near $4.40. The DOT price is currently increasing to retest the $4.40 resistance level. Meanwhile, a retraced candle body approached the 61.8% Fibonacci retracement line on the October 26 rise.
The retracement means that DOT/USD will rise to the 1.618 Fibonacci extension or $4.95 level. The price movement suggests that buyers are driving the coin to retest the current resistance level. The currency will reach the Fibonacci extension if the current resistance is broken. In contrast, the altcoin will be forced to trade between $4.00 and $4.40, where the current resistance level remains unbroken.

Technical indicators:
Major Resistance Levels – $10, $12, $14
Major Support Levels – $8, $6, $4
Polkadot (DOT) Indicator Analysis
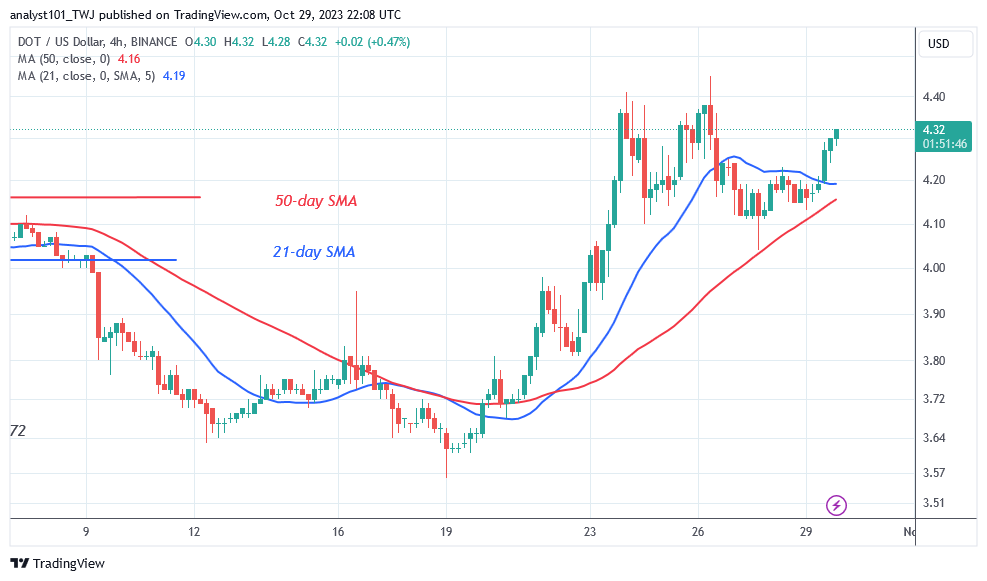
The bullish momentum persisted above the moving average lines as price bars rose further. The price bars have been constantly above the moving average lines for the previous week. The crypto’s price is attempting its third effort to breach the present resistance level in the lower period.
What Is the Next Direction for Polkadot (DOT)?
The cryptocurrency asset is aiming for a high of $5.00 as it challenges the resistance at $4.40. However, the upward trend is having difficulty breaking through at the $4.40 high. In the short term, the altcoin has developed a price range between $4.00 and $4.40. The breaking of the range-bound levels will determine whether the market moves upward or lower.

You can purchase Lucky Block here. Buy LBLOCK
Note: Cryptosignals.org is not a financial advisor. Do your research before investing your funds in any financial asset or presented product or event. We are not responsible for your investing results


