Polkadot’s Uptrend Continues as It Remains above $6.60
Estimated Reading Time: 2 minutes
Don’t invest unless you’re prepared to lose all the money you invest. This is a high-risk investment and you are unlikely to be protected if something goes wrong. Take 2 minutes to learn more
Polkadot (DOT) Long-Term Analysis: Bullish
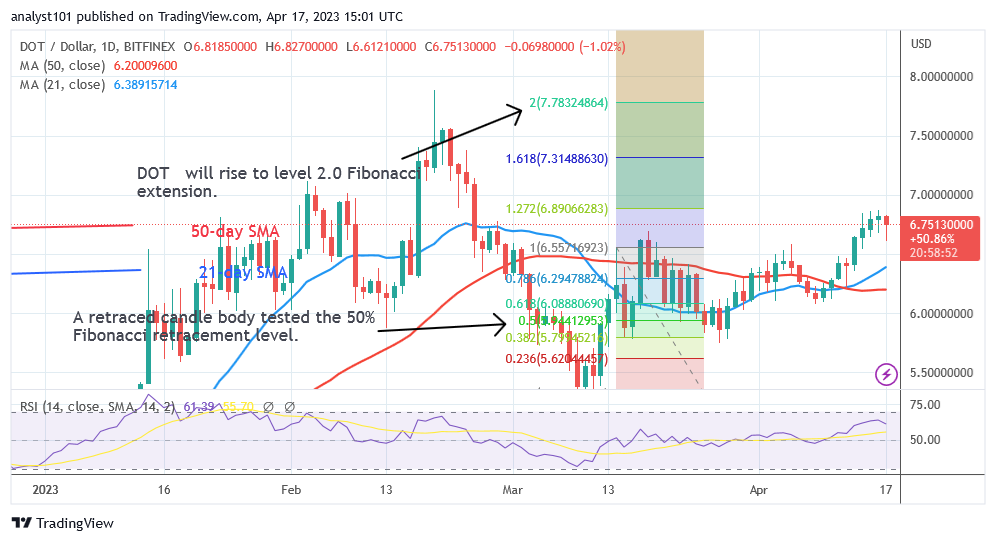
Polkadot (DOT) price has risen above the moving average lines as it remains above $6.60. At the time of writing, the value of the coin is $6.73. According to the price indication, Polkadot is projected to rise even further and surpass its prior highs. On the March 14 upswing, a retraced candle body tested the 50% Fibonacci retracement level. In accordance with the retracement, DOT will increase to level 2.0 of the Fibonacci extension, or $7.78. The altcoin is rejected about $7.00 based on price change. The rising trend will continue to the $7.00 high.
Polkadot (DOT) Indicator Analysis
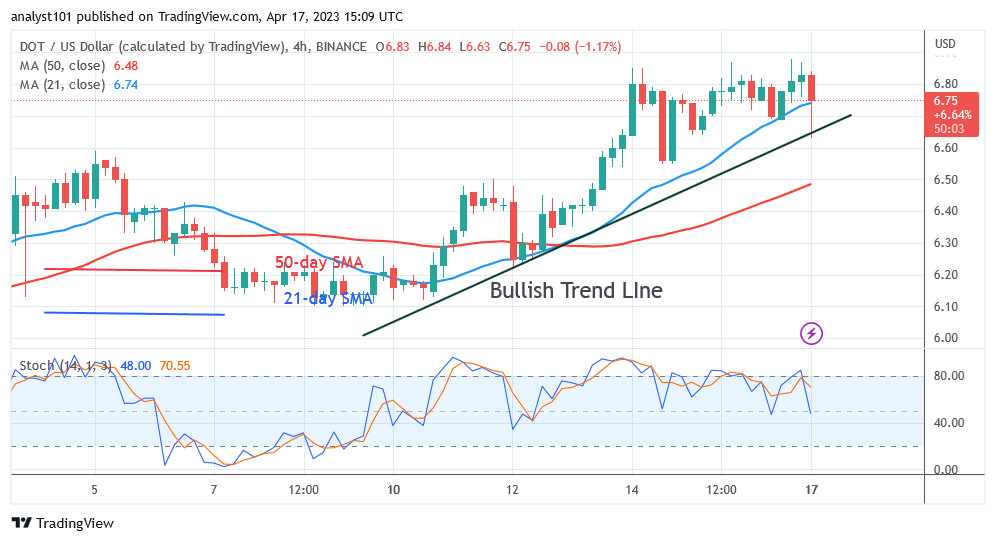
On the Relative Strength Index for period 14, Polkadot is at level 60. Polkadot may rise as they are still in the positive trend zone. The price bars are above the moving average lines which indicate further upward move. Below the daily Stochastic’s 80 level, the Polkdot has entered a negative momentum. As long as it remains above the 21-day SMA, the negative momentum has diminished.
Technical indicators:
Major Resistance Levels – $10, $12, $14
Major Support Levels – $8, $6, $4
What Is the Next Direction for Polkadot (DOT)?
Polkadot is being rejected at the $7.00 resistance level as it remains above $6.60. The price of DOT has risen again above the 21 -day SMA. The upswing will continue if the 21-day support holds. The market is expected to reach a high of $8.
You can purchase Lucky Block here. Buy LBLOCK
Note: Cryptosignals.org is not a 1a financial advisor. Do your research before investing your funds in any financial asset or presented product or event. We are not responsible for your investing results