Ethereum Holds above the $3,000 Support, Unable to Break Recent High
Estimated Reading Time: 2 minutes
Don’t invest unless you’re prepared to lose all the money you invest. This is a high-risk investment and you are unlikely to be protected if something goes wrong. Take 2 minutes to learn more

Ethereum Price Long-Term Analysis: Bearish
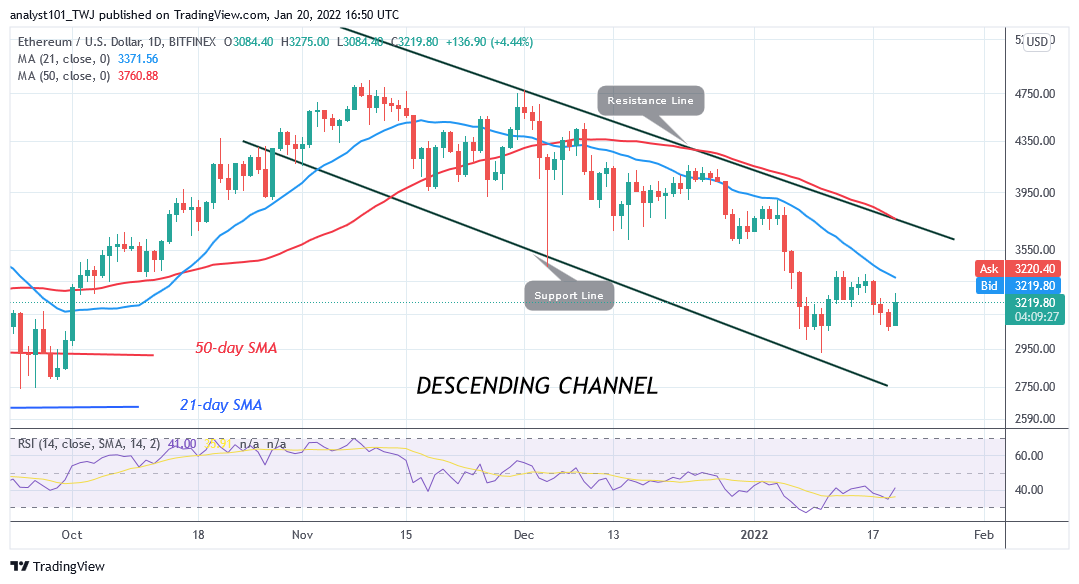
Ethereum’s (ETH) price continues its downward correction but unable to break recent high .Ether fluctuates between $3,010 and $3,400. The largest altcoin is rising upward after falling to the low of $3,049. The $3,000 support is the historical price level of August 8. On August 8, Ether consolidated above the $3,000 support for three weeks before the resumption of the uptrend. Ether rallied to $4,000 high. Today, the market is resuming upward. A break above the $3,400 resistance will push the altcoin to the high of $3,800.
Ethereum Indicator Analysis
Ether is at level 39 of the Relative Strength Index period 14. The altcoin is in a downtrend zone and below the centerline 50. The crypto’s price is below the 21-day line and the 50-day line moving averages which cause the altcoin to fall. Ether is above 30% area of the daily stochastic. The market is in a bullish momentum.
Technical indicators:
Major Resistance Levels – $2, 600, $2,800, $3,000
Major Support Levels – $1.500, $1, 300, $1,100
What Is the Next Direction for Ethereum?
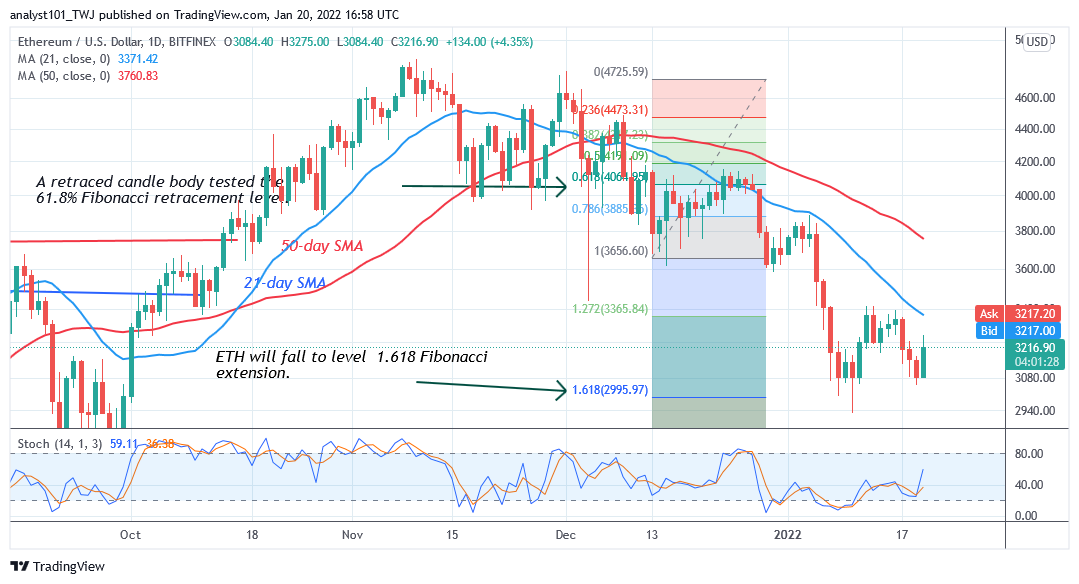
Ether has been in a downward move but unable to break recent High. The selling pressure has reached bearish exhaustion. Meanwhile, on December 13 downtrend; a retraced candle body tested the 61.8% Fibonacci retracement level. The retracement indicates that Ethereum will fall to level 1.618 Fibonacci extension or $2,995.97 .
You can crypto coins here. Buy Tokens
Note: Cryptosignals.org is not a financial advisor. Do your research before investing your funds in any financial asset or presented product or event. We are not responsible for your investing results