Ethereum Is in Decline but Risks Falling below $3,600
Estimated Reading Time: 3 minutes
Don’t invest unless you’re prepared to lose all the money you invest. This is a high-risk investment and you are unlikely to be protected if something goes wrong. Take 2 minutes to learn more

Ethereum Price Long-Term Analysis: Bearish
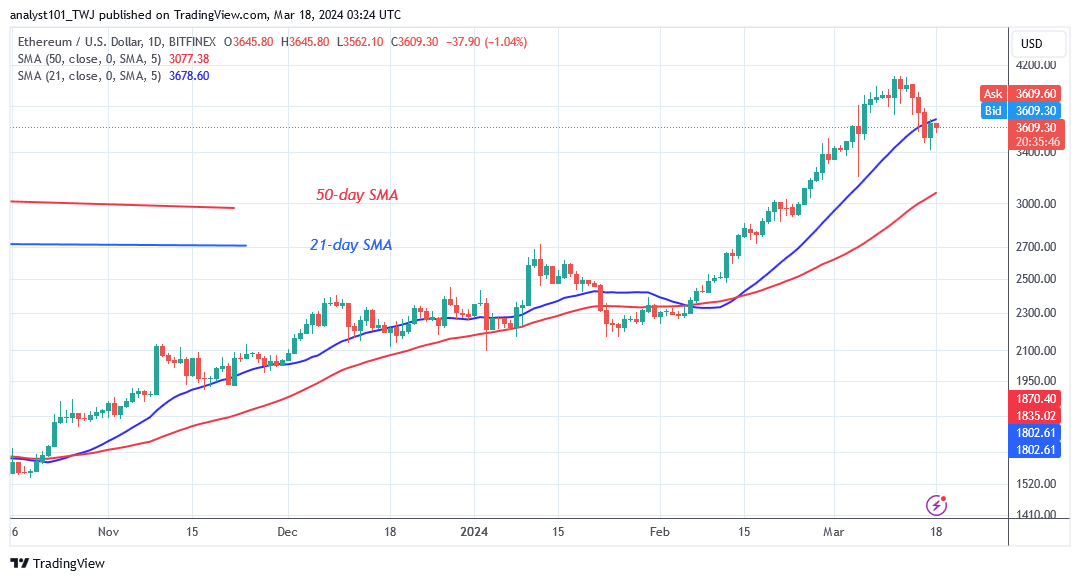
Ethereum (ETH) price has dropped between the moving average lines but risks falling below $3,600. Ether is falling as it fails to break the $4,000 psychological price barrier. The largest altcoin has dropped below the 21-day SMA but remains above the 50-day SMA. The crypto’s price has fallen to a low of $3,587 at the time of writing. Ether is currently plummeting after retesting the 21-day SMA.
If the selling pressure continues, the altcoin will fall even deeper to a low above the 50-day SMA. In other words, Ether risks decline above the $3,075 support. Meanwhile, ETH/USD is staying above the $3,500 support level as buyers want to resume an upward trend above the 21-day SMA.
Technical indicators:
Major Resistance Levels – $3, 600, $3,800, $4,000
Major Support Levels – $2.600, $2, 400, $2,200
Ethereum Indicator Analysis
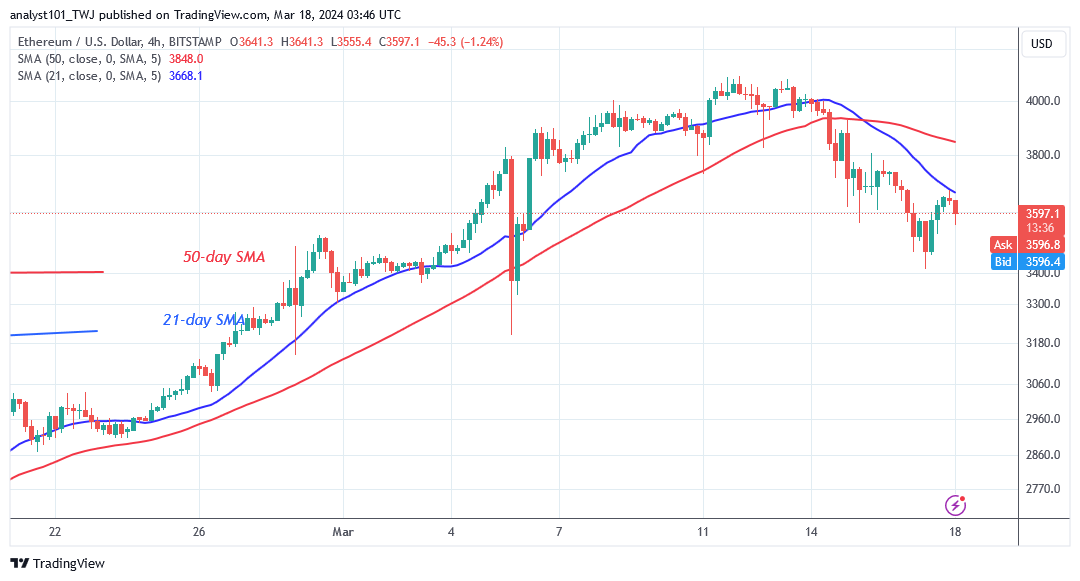
Ether is trading between the moving average lines following a drop below the 21-day SMA. Bulls and bears will both attempt to take the price under their control when it is in a range. On the 4-hour chart, the price bars are below the moving averages. However, the cryptocurrency price is battling to break above the 21-day SMA. If the moving average lines reject Ether, its price will fall.
Conclusion
On the 4-hour chart, Ether is declining below the moving average lines but risks falling below $3,600. The largest altcoin trades in a narrow range below the moving average lines. On March 17, the altcoin returned to the prior low above the $3,400 support. This will be the second time the bears will test the existing support level of $3,400.
During the initial decline, bulls bought dips and resumed the upward trend. However, the crypto signal would turn negative if the current support was broken.
You can purchase Lucky Block here. Buy LBLOCK
Note: Cryptosignals.org is not a financial advisor. Do your research before investing your funds in any financial asset or presented product or event. We are not responsible for your investing results

