Ethereum Rallies to an Overbought Region at $3,120, May Face Decline to $2,882
Estimated Reading Time: 2 minutes
Don’t invest unless you’re prepared to lose all the money you invest. This is a high-risk investment and you are unlikely to be protected if something goes wrong. Take 2 minutes to learn more

Free Crypto Signals Channel
Ethereum Price Long-Term Analysis: Bullish
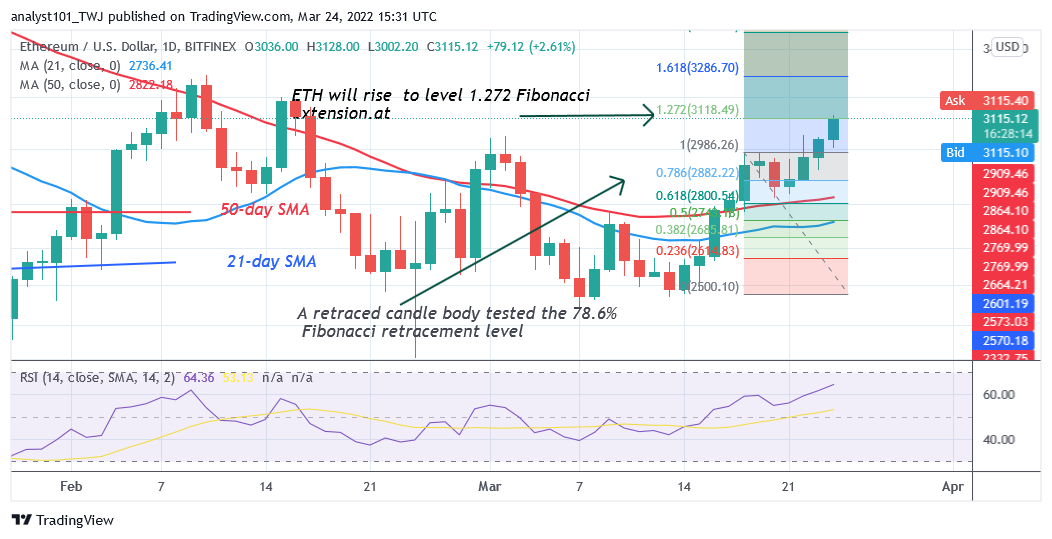
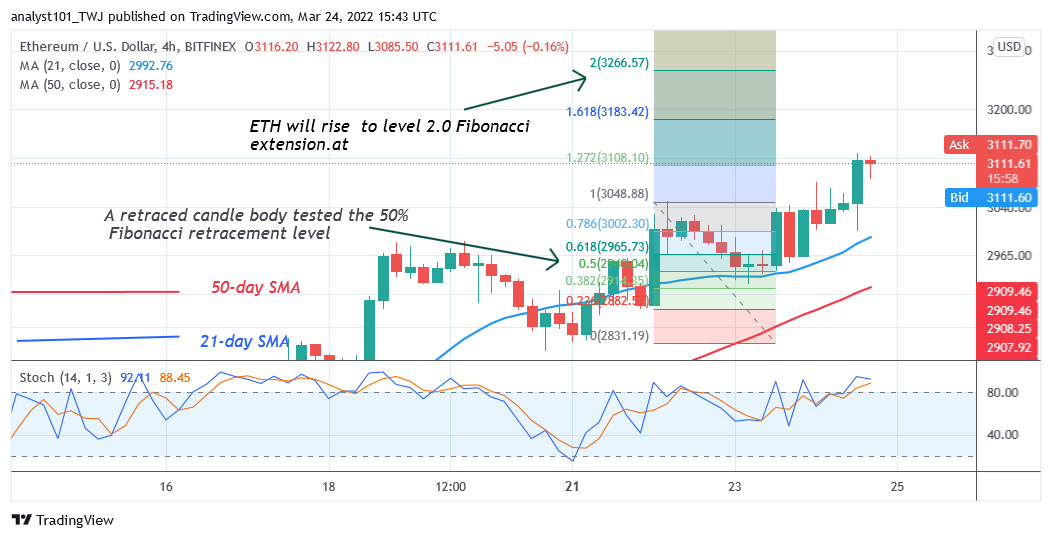
Ethereum’s (ETH) price has reached the high of $3,108 as it may face decline to $2,882. The current bullish momentum has broken the resistance at $3,000 and it is approaching the resistance at $3,200. The price indicators are said to indicate the overbought condition of the altcoin. Further upward movement of the cryptocurrency is doubtful as the market reaches the overbought region. Meanwhile, on March 18 uptrend; a retraced candle body tested the 78.6% Fibonacci retracement level. The retracement indicates that ETH will rise but reverse at level 1.272 Fibonacci extension or $3,118.49 From the price action, Ether has reached level 1.272 Fibonacci extension.
Ethereum Indicator Analysis
Ether is at level 64 of the Relative Strength Index for period 14. The market is approaching the overbought region at level 70. Ether is capable of a further upward move in the uptrend zone. The crypto’s price is well above the moving average indicating further upward moves. The largest altcoin is out of downward correction. Ether is above the 80% range of the daily stochastic. The market has been an overbought region for some time. Ether may decline soon.
Technical indicators:
Major Resistance Levels – $2, 600, $2,800, $3,000
Major Support Levels – $1.500, $1, 300, $1,100
What Is the Next Direction for Ethereum?
On the 4-hour chart, Ethereum is in an uptrend as it may face decline to $2,882. Ether‘s price is making a series of higher highs and higher lows. Meanwhile, on March 22 uptrend; a retraced candle body tested the 50% Fibonacci retracement level. The retracement indicates that ETH will rise to a level 2.0 Fibonacci extension or $3,266.57.
You can crypto coins here. Buy LBlock
Note: Cryptosignals.org is not a financial advisor. Do your research before investing your funds in any financial asset or presented product or event. We are not responsible for your investing results