Ethereum Resumes Its Bullish Advance and Consolidates Above $3,200
Estimated Reading Time: 2 minutes
Don’t invest unless you’re prepared to lose all the money you invest. This is a high-risk investment and you are unlikely to be protected if something goes wrong. Take 2 minutes to learn more

Ethereum Price Long-Term Analysis: Bearish
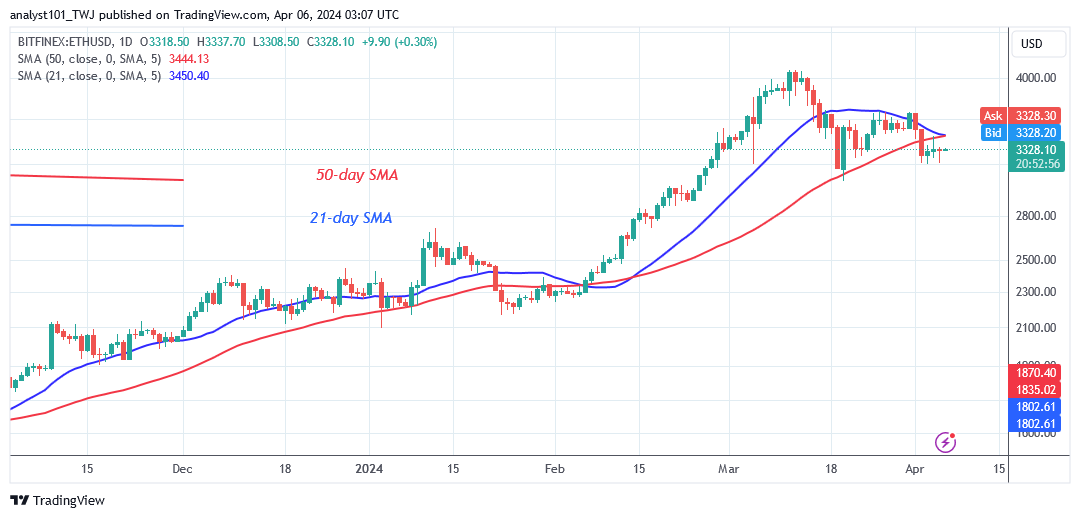
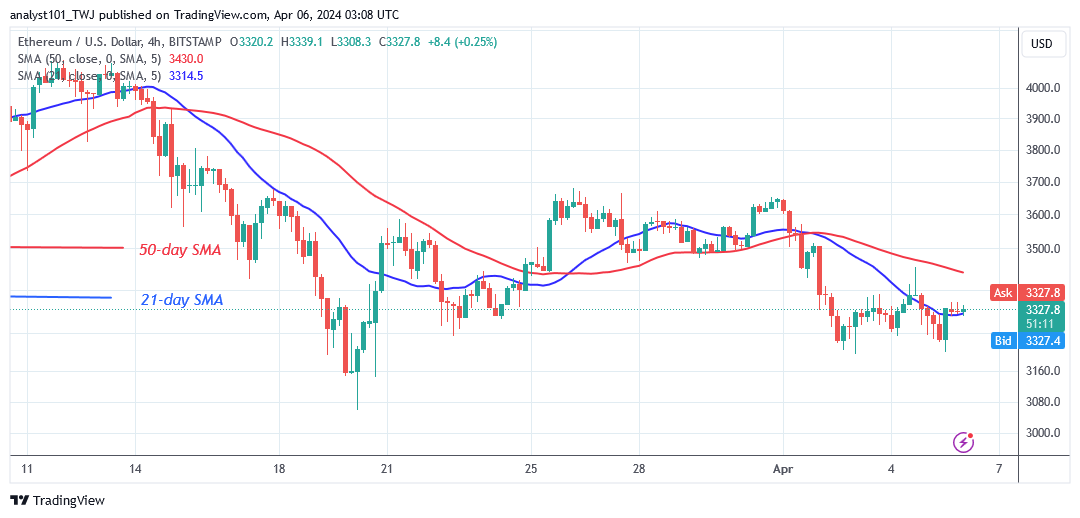
Ethereum’s (ETH) price falls below the moving average lines and consolidates above $3,200. There has been less selling pressure above $3,200 since the drop on April 2, 2024. The cryptocurrency has been consolidating above its current support for the past week. The development of Doji candlesticks has contributed to the cryptocurrency’s delayed price movements.
ETH/USD was $3,358 at the time this article was written. The increasing trend is being restrained by the moving average lines and the resistance level at $3,400. Nonetheless, if the altcoin rebounds, the resistance levels will be broken, and Ether will return to $4,000. On the downside, the bulls have maintained their current support at $3,200.
Technical indicators:
Major Resistance Levels – $3, 600, $3,800, $4,000
Major Support Levels – $2.600, $2, 400, $2,200
Ethereum Indicator Analysis
Ether’s price bars have halted below the moving average lines due to the presence of Doji candlesticks. Doji candlesticks symbolize traders who are unsure about the direction of the market. The price bars are between the moving average lines, implying that price fluctuations have resumed.
Conclusion
Ethereum’s bearish trend subsides and consolidates above $3,200. Currently, the altcoin is trading in a confined range after bulls purchased dips. Ethereum is consolidating above $3,200 but below $3,400. The bulls have attempted to restart their bullish rise. Meanwhile, the cryptocurrency signal has fluctuated due to the existence of Doji candlesticks.
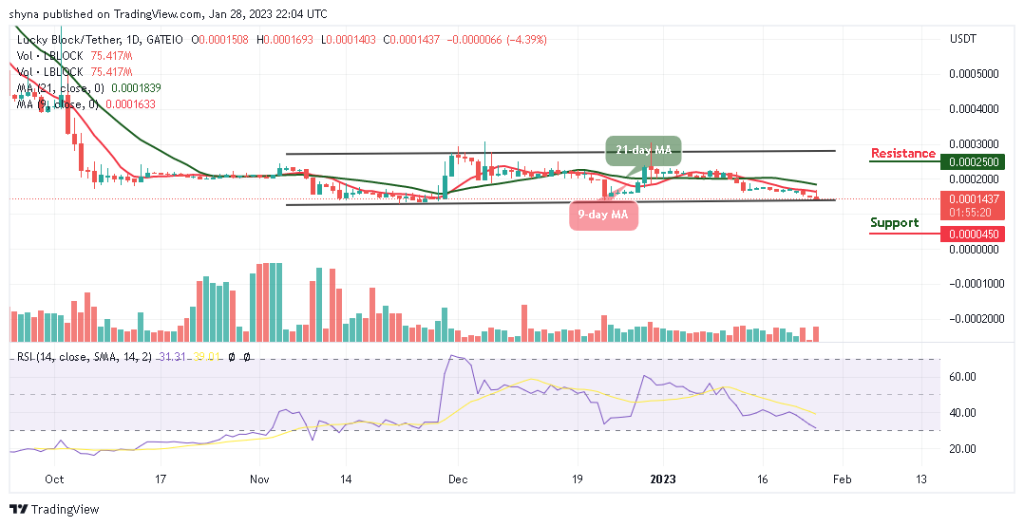
You can purchase Lucky Block here. Buy LBLOCK
Note: Cryptosignals.org is not a financial advisor. Do your research before investing your funds in any financial asset or presented product or event. We are not responsible for your investing results
_______________________________________________________________________
– crypto signals