Ethereum Rises but Shows Significant Buying above the $1,750 Low
Estimated Reading Time: 3 minutes
Don’t invest unless you’re prepared to lose all the money you invest. This is a high-risk investment and you are unlikely to be protected if something goes wrong. Take 2 minutes to learn more
Ethereum Price Long-Term Analysis: Bearish
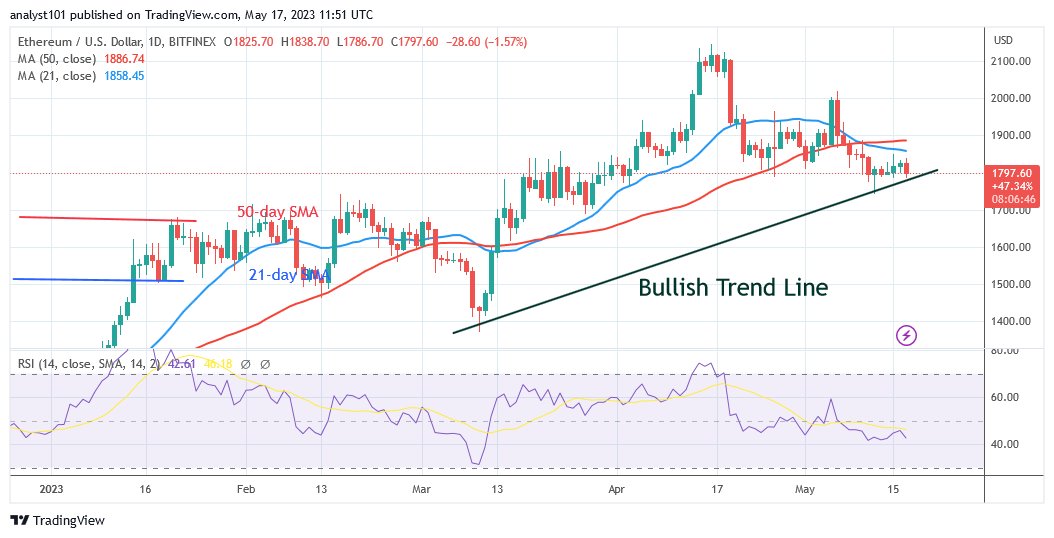
The price of Ethereum (ETH) has regained bullish momentum as it shows significant buying above the $1,750 low. Ether has been consolidating above the $1,700 support ever since the bearish fall on May 12. The cryptocurrency asset has been trading in a narrow range between $1,750 and $1,850 for the past week. The Doji candlestick, which has a small body and is indecisive, has been used to describe the price motion of Ether. The presence of Doji candlesticks has limited the price movement. On the plus side, a price increase will encourage Ether to pick up its positive trend. The biggest altcoin will be able to surpass the moving average lines or the $1.900 resistance level. Once more, Ether will surpass its previous top of $2,000. The bulls are defending the existing support on the downside. The May 12 candlestick shows significant buying at lower price levels.
Technical indicators:
Major Resistance Levels – $2, 600, $2,800, $3,000
Major Support Levels – $1.600, $1, 400, $1,200
Ethereum Indicator Analysis
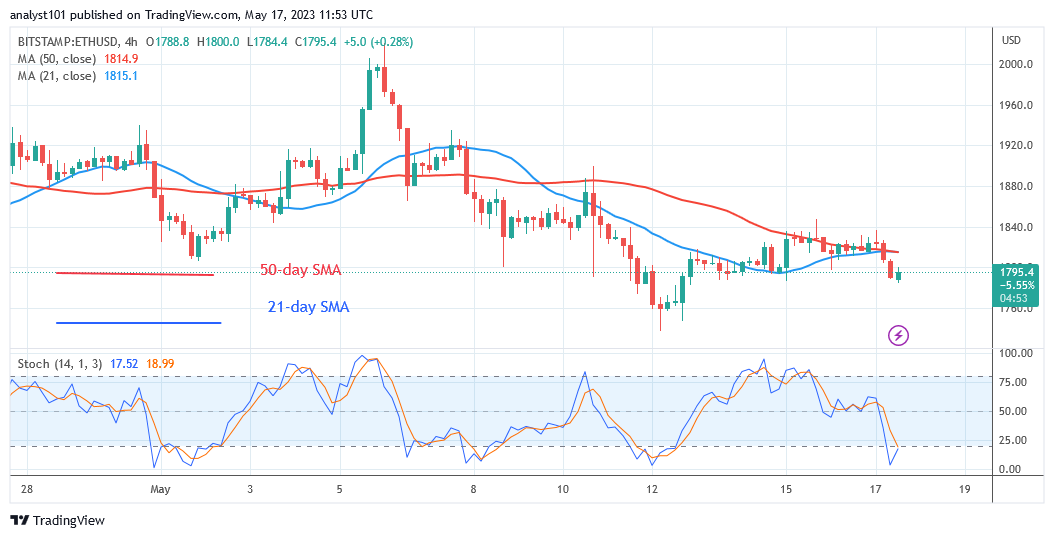
Ether is at level 45 for period 14 on the Relative Strength Index. Due to the existence of Doji candlesticks, the RSI has not changed. Price bars below moving average lines indicate more decline. Ether is currently trading in the oversold area of the market. The daily Stochastic of the altcoin is below level 20. Selling pressure at the moment has reached a point of bearish exhaustion.
What Is the Next Direction for Ethereum?
Ether is currently moving in a range above the $1,750 support but shows significant buying above the $1,750 Low. Due to the presence of small-body unresolved candlesticks, the largest altcoin has not yet trended. Until a price rebound or a breakdown is realized, the current range-bound movement may last for a few days.
You can buy crypto coins here. Buy LBLOCK
Note: Cryptosignals.org is not a financial advisor. Do your research before investing your funds in any financial asset or presented product or event. We are not responsible for your investing results


