Ethereum (ETH/USD) Surges Northward Higher Approaching $3,200 Resistance Level
Estimated Reading Time: 3 minutes
Don’t invest unless you’re prepared to lose all the money you invest. This is a high-risk investment and you are unlikely to be protected if something goes wrong. Take 2 minutes to learn more
Ethereum Price Prediction – May 3
The ETH/USD market worth has continued to move at a higher pressurizing rate through some resistant trading points to now achieve a new all-time value closely towards the point of $3,200.
ETH/USD Market
Key Levels:
Resistance levels: $3,400, $3,600, $3,800
Support levels: $2,600, $2,400, $2,200
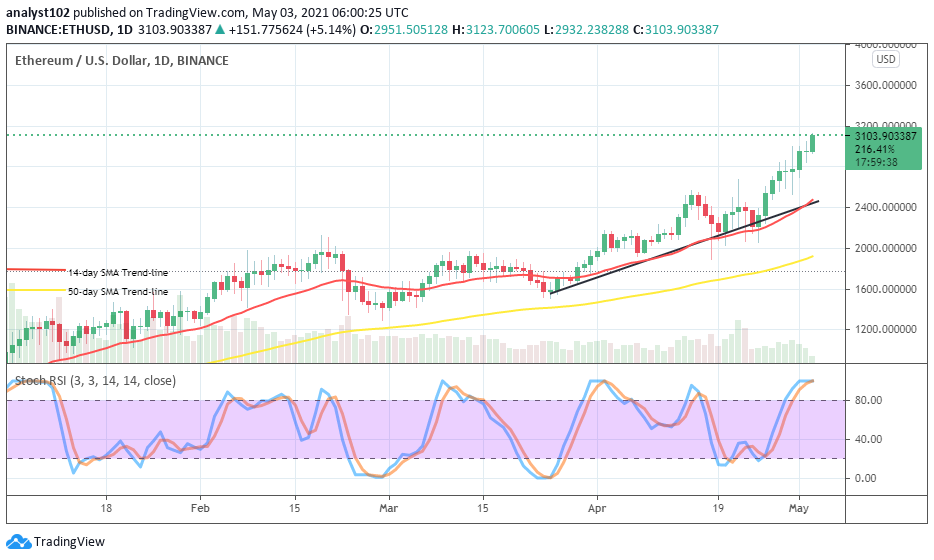
ETH/USD – Daily Chart
On the ETH/USD daily chart, it is again traced back that the emergence of a bullish candlestick on April 26 has led to the spanning of the current uptrend from around $2,600 to now closely averaging the higher level of $3,200. The 14-day SMA trend-line and the bullish trend-line are placed around the $2,400 support level. And, the 50-day SMA indicator is situated a bit below the $2,000 support line underneath the smaller SMA as they all point towards the north under the current trading price area. The stochastic Oscillators are located in the overbought region with closed hairs. That could eventually portend a change in the market direction soon.
Will the ETH/USD market keeps its current pace of pushes northward further?
As of writing, the ETH/USD bulls still intensify their pushing efforts to break through some of the resistance lines in the market. And, an indication has surfaced that the current northward pressures may soon resort into a consolidation moving mode which may cause a kind pit stop around the high level of $3,200 in a near session. If price trades for long in that area, the market trend may begin to experience a line of sideways trading situation afterward.
The points in between the $3,200 and $3,600 are expected to be the most likely zones where bears need to await the potential reversal move that the ETH/USD trade may face. However, as price now approaches one of the key resistances, the presumed correction may form around it in no time. But, a breakout of it, will most definitely cause a whipsaw in the bears’ market positioning.
ETH/BTC Price Analysis
The ETH/BTC daily comparing chart has distinctively depicted that the base crypto is currently dominating the crypto-economy trading outlook as paired with the counter trading instrument. Both the 14-day SMA trend-line and the bullish trend-line are far underneath the level at which the base crypto is pressing northwardly against its countering instrument. The 50-day SMA is located below the smaller SMA with a visible space between them. The Stochastic Oscillators have unwittingly moved downward from the overbought region to seemingly attempting to cross the hairs at range 40 back toward the north. That suggests that ETH has not fully exhausted its domineering efforts as weighed against BTC.
Note: cryptosignals.org is not a financial advisor. Do your research before investing your funds in any financial asset or presented product or event. We are not responsible for your investing results.