Is Lucky Block (LBLOCK) Headed for a Breakout?
Estimated Reading Time: 3 minutes
Don’t invest unless you’re prepared to lose all the money you invest. This is a high-risk investment and you are unlikely to be protected if something goes wrong. Take 2 minutes to learn more

Lucky Block (LBLOCK) Technical Analysis – July 11
Lucky Block (LBLOCK) is currently priced at $0.0000172, reflecting a decrease of 5.88% over the last 24 hours. Despite this, LBLOCK has gained 3.38% over the past week, demonstrating its resilience. During the last 24 hours, 26,933,607 LBLOCK coins were traded, with a total trading volume of $453. This technical analysis explores Lucky Block’s performance through its daily and 4-hour charts.
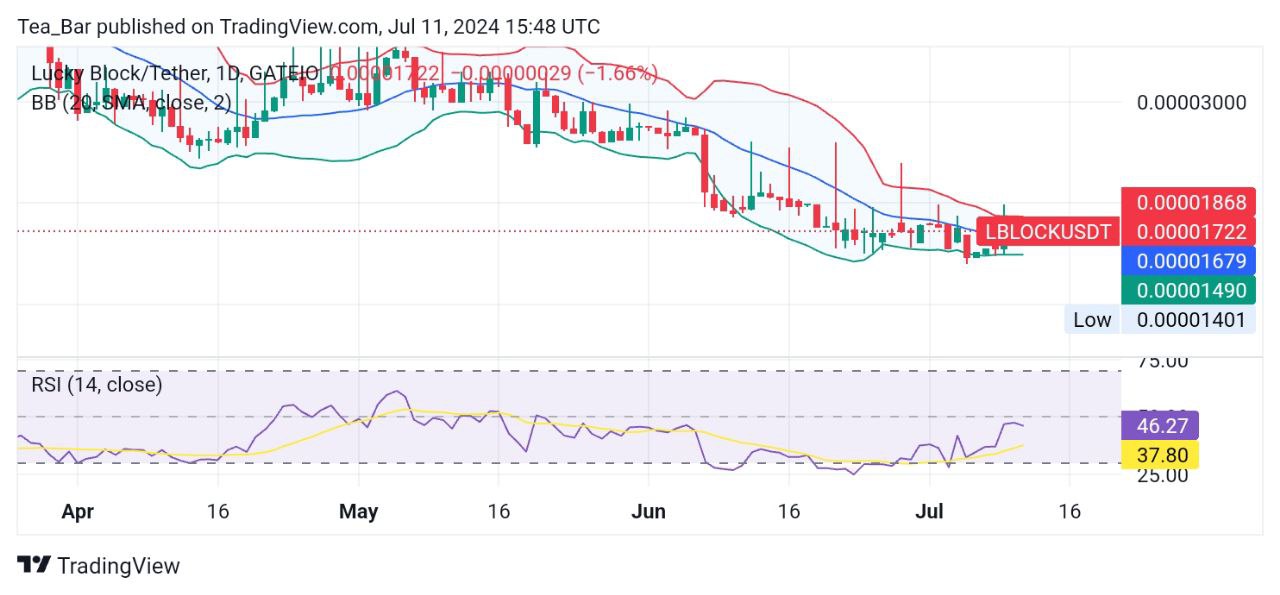
Source: TradingView
Daily Chart Analysis
On the daily chart, Lucky Block (LBLOCK) has experienced a slight decline. However, the 3.38% gain over the past week indicates a positive trend. The Bollinger Bands on the daily chart show an upper band at $0.0000186, a middle band at $0.0000167, and a lower band at $0.0000149. This setup suggests that LBLOCK is trading close to the middle band, indicating a potential for upward movement if the market sentiment turns more favorable.
The RSI (Relative Strength Index) for the past 14 days stands at 37.80, which places LBLOCK in the lower neutral zone, leaning towards being oversold. This could signal a buying opportunity if the price begins to rise, as it suggests that selling pressure might be easing.
4-hour Chart Analysis
The 4-hour chart offers a closer look at Lucky Block’s short-term performance. The Bollinger Bands indicate an upper band at $0.0000188, a middle band at $0.0000163, and a lower band at $0.0000137. This tighter range compared to the daily chart suggests less volatility in the short term but also room for upward movement.
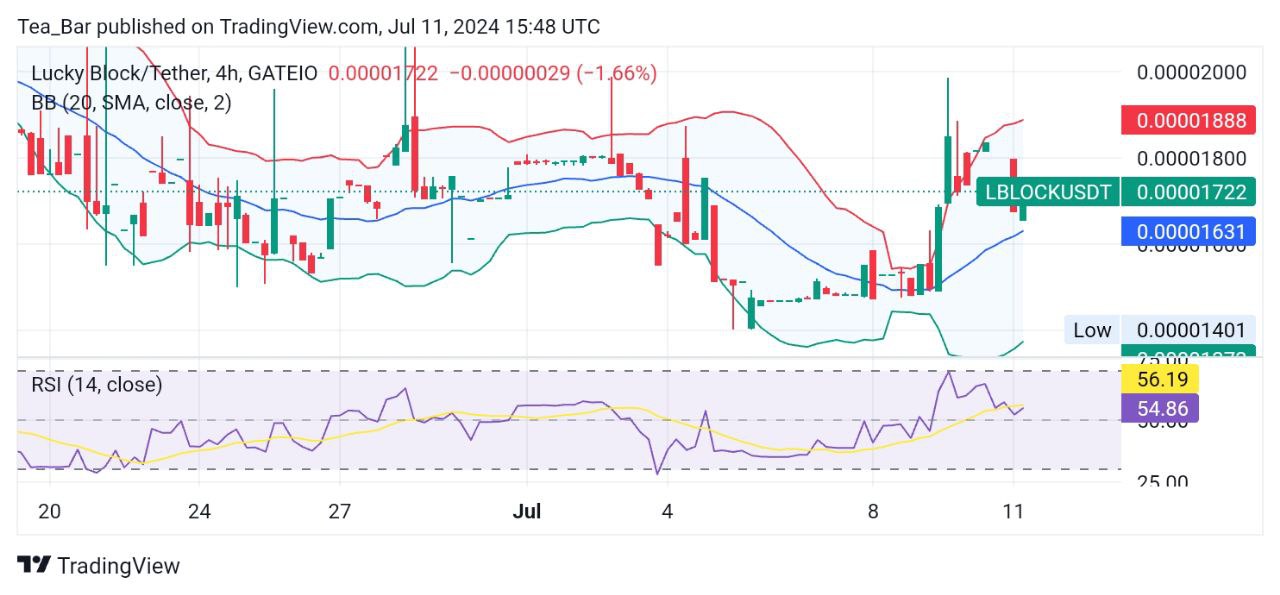
Source: TradingView
The RSI on the 4-hour chart is at 56.19, indicating a balanced sentiment among traders. This level is closer to the overbought zone but still suggests strong buying interest, which could lead to further positive price action if momentum is maintained.
Conclusion
Lucky Block (LBLOCK) shows a mixed but promising performance with a slight decline in the last 24 hours but a positive gain over the past week. The daily and 4-hour charts indicate potential for further growth, with the RSI levels suggesting that the coin is nearing oversold territory on the daily chart and showing strong buying interest on the 4-hour chart.
Market players should watch for continued momentum and key resistance levels, particularly the upper Bollinger Bands, which could signal stronger bullish trends. Overall, Lucky Block’s ability to rebound from recent lows and its current market stability indicate a positive outlook for the near future.
You can purchase Lucky Block here. Buy LBLOCK.