Lucky Block (LBLOCK) Soars 35% in 24 Hours: Technical Analysis Reveals Bullish Trend
Estimated Reading Time: 3 minutes
Don’t invest unless you’re prepared to lose all the money you invest. This is a high-risk investment and you are unlikely to be protected if something goes wrong. Take 2 minutes to learn more

Lucky Block (LBLOCK) Technical Analysis – July 9
Lucky Block (LBLOCK) is showing impressive gains with its current price at $0.0000188, marking a significant 35.05% increase over the past 24 hours. The trading volume for this period saw 281,456,224 LBLOCK coins exchanged, amounting to $5,732.
This technical analysis provides an in-depth look at Lucky Block’s performance through its daily and 4-hour charts.
Daily Chart Analysis
On the daily chart, Lucky Block (LBLOCK) has seen a remarkable rise. The price increase of 35.05% in the last 24 hours is complemented by a weekly gain of 16.04% and a monthly increase of 2.28%. These consistent upward movements highlight a strong bullish sentiment.
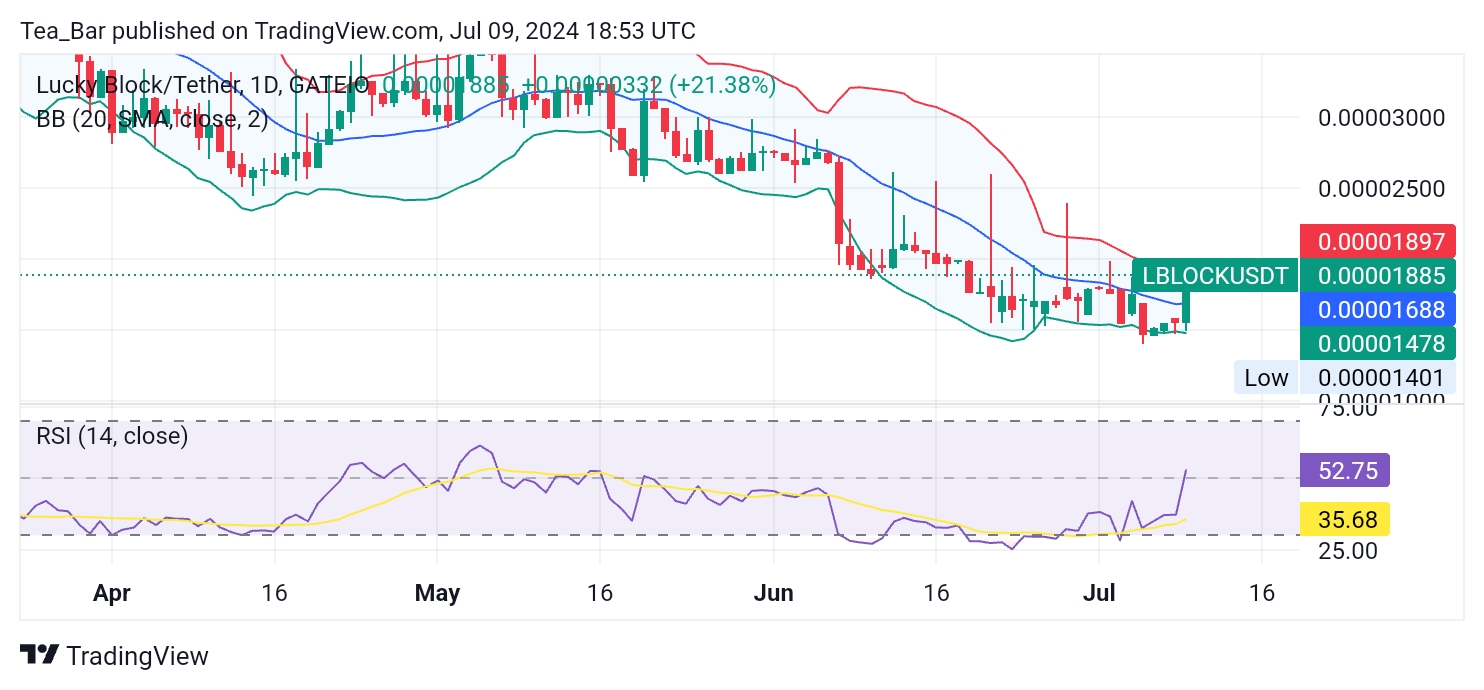
Source: TradingView
The Bollinger Bands on the daily chart indicate an upper band at $0.00001897, a middle band at $0.00001688, and a lower band at $0.00001478. These bands suggest that LBLOCK is nearing the upper threshold, which might indicate an overbought condition if the price continues to rise.
The RSI (Relative Strength Index) stands at 52.75, placing LBLOCK in the neutral zone, suggesting a balanced buying and selling pressure.
4-hour Chart Analysis
The 4-hour chart further supports the positive outlook for Lucky Block (LBLOCK). The Bollinger Bands here show an upper band at $0.00001734, a middle band at $0.00001536, and a lower band at $0.00001339.
This range indicates less volatility compared to the daily chart, but still shows room for upward movement.
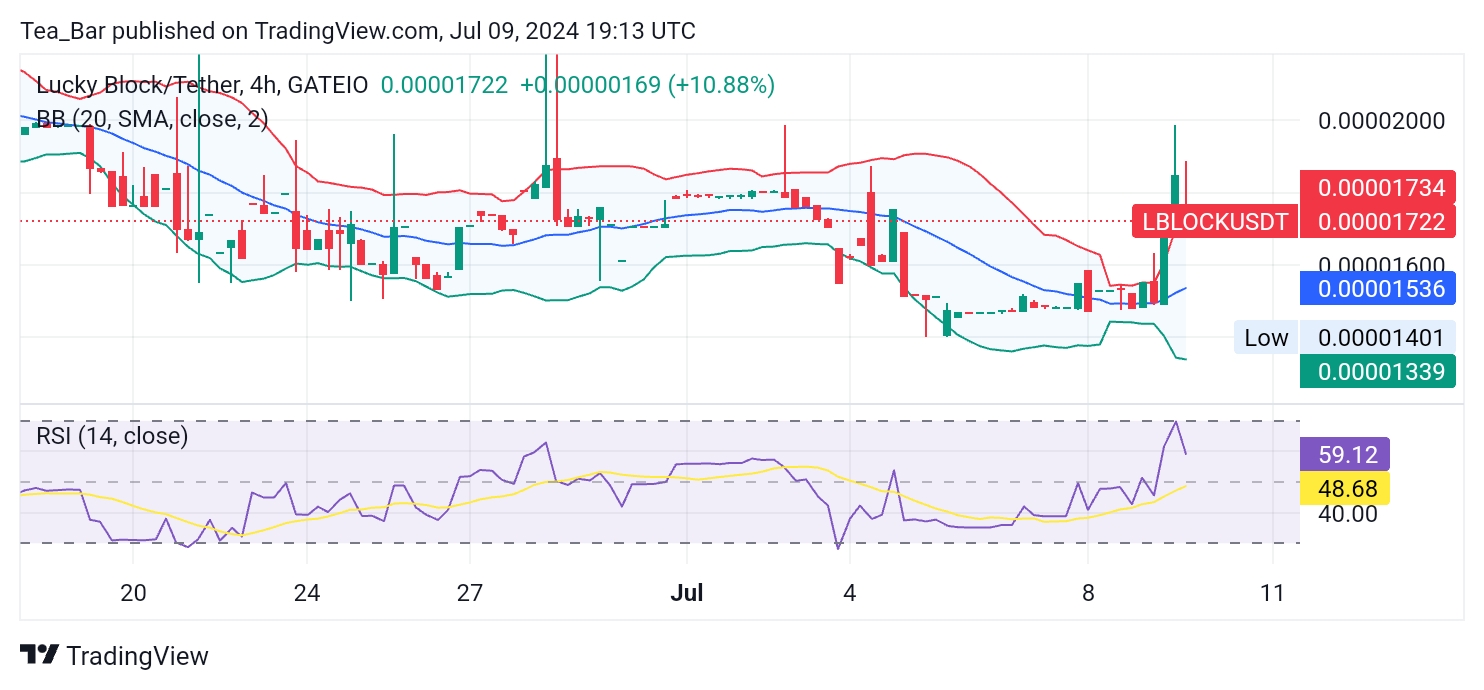
Source: TradingView
The RSI on the 4-hour chart is at 59, which is closer to the overbought zone but still indicates strong buying interest. This suggests that LBLOCK may continue to see positive price action in the short term, particularly if it can maintain the current momentum.
Conclusion
Lucky Block (LBLOCK) is experiencing significant positive momentum, with a notable 35.05% increase in the last 24 hours and consistent gains over the past week and month. The technical indicators from both the daily and 4-hour charts point to a strong bullish trend.
While the price is nearing the upper Bollinger Bands, the RSI levels suggest that there is still potential for further growth.
You can purchase Lucky Block here. Buy LBLOCK.