Lucky Block (LBLOCK) Slides: Price Analysis Reveals Bearish Pressure
Estimated Reading Time: 2 minutes
Don’t invest unless you’re prepared to lose all the money you invest. This is a high-risk investment and you are unlikely to be protected if something goes wrong. Take 2 minutes to learn more
Lucky Block (LBLOCK) Price Analysis: June 22, 2024
Lucky Block (LBLOCK) currently trades at $0.0000166, marking a 4.08% drop over the last 24 hours. The daily trading volume stands at $8,426, with 412,624,473 LBLOCK coins exchanged. The token has seen a 3.31% decline over the past week and a steep 28.97% fall over the last month.
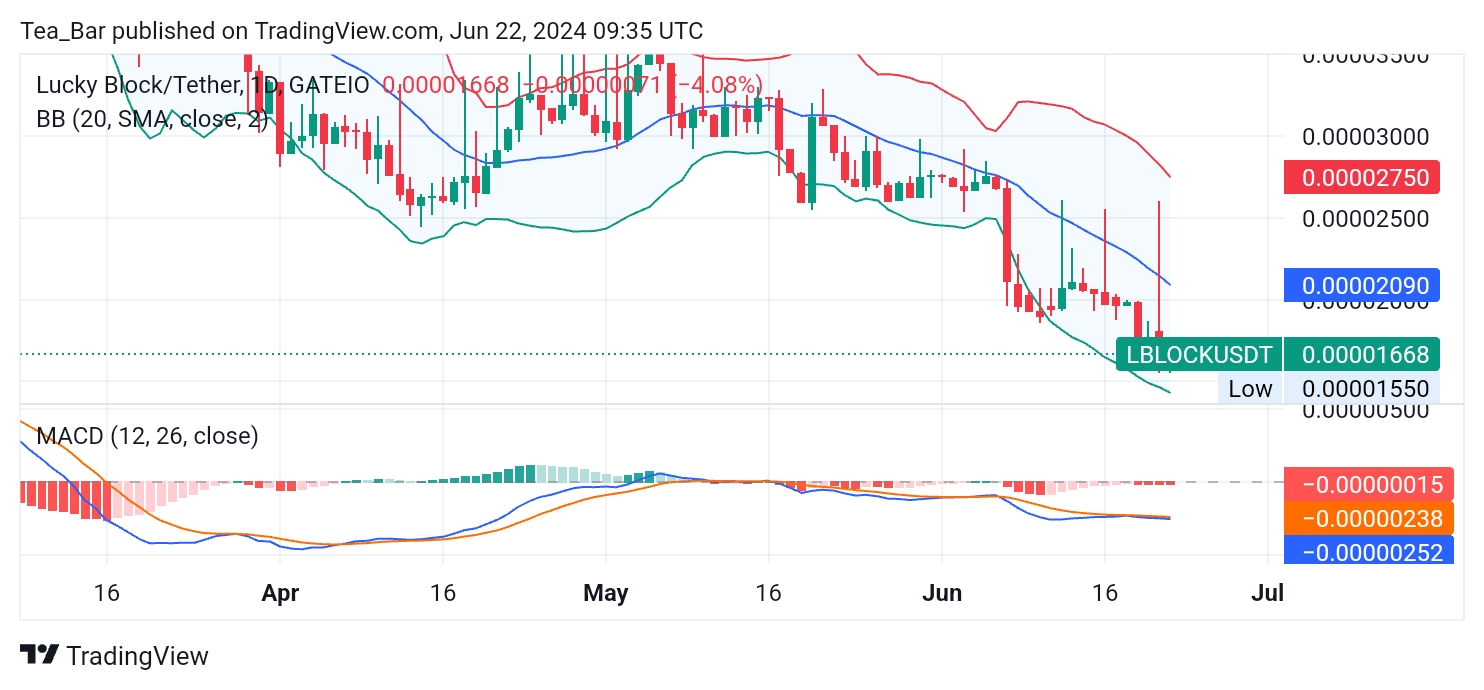
1 Day Chart Analysis
The daily Bollinger Bands for Lucky Block highlight substantial price volatility. The upper band is at $0.0000275, the middle band at $0.0000209, and the lower band at $0.0000155. LBLOCK is trading close to the lower Bollinger Band, suggesting it may be oversold.
Additionally, the MACD (Moving Average Convergence Divergence) is below the zero line with red bars, indicating strong bearish momentum. This bearish MACD signal underscores ongoing selling pressure.
4 Hour Chart Analysis
On the 4-hour chart, the Bollinger Bands are narrower, with the upper band at $0.0000206, the middle band at $0.00001818, and the lower band at $0.0000157. LBLOCK’s price proximity to the lower band signals a persistent downward trend.
The MACD on this timeframe also remains below the zero line with red bars, confirming the bearish sentiment seen in the daily analysis. The consistent indicators across both timeframes suggest a continuous downward trajectory.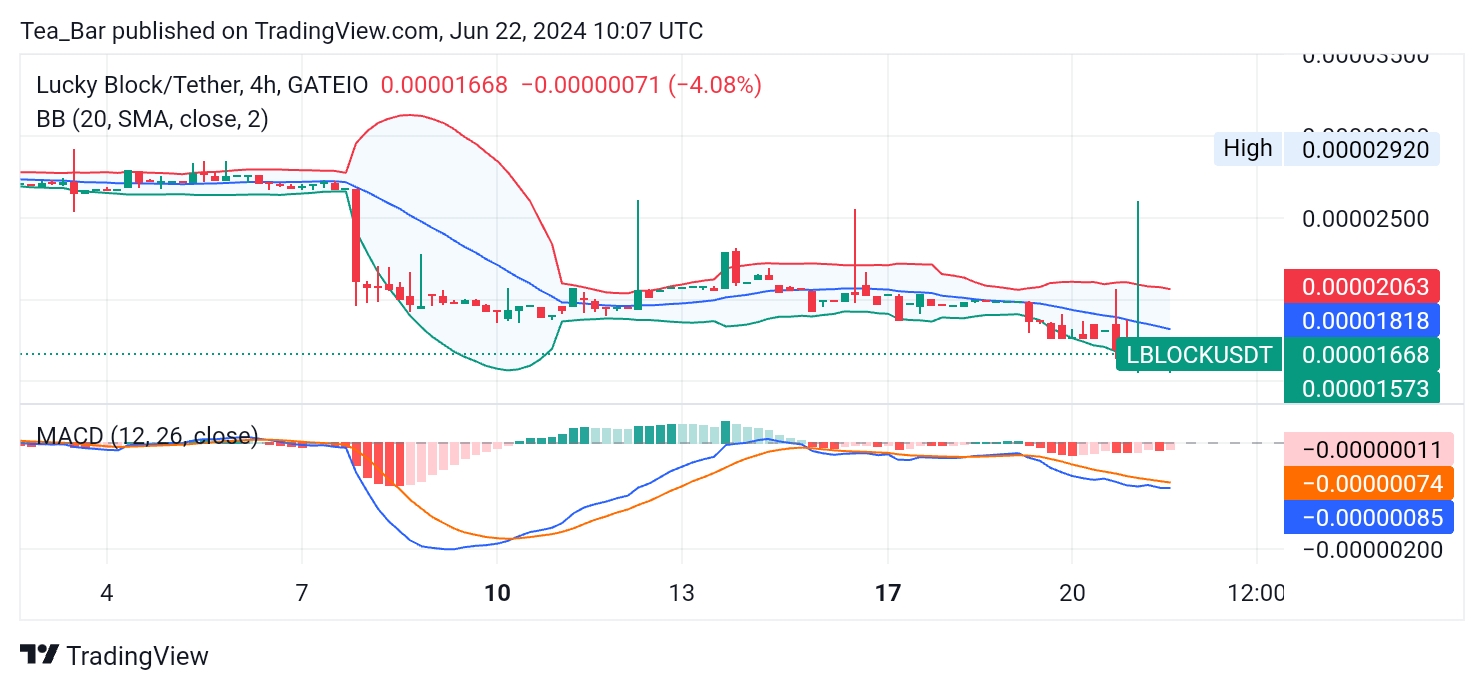
Conclusion
Lucky Block (LBLOCK) faces significant bearish pressure, reflected in its declining price over both short and long-term periods. The daily chart indicates an oversold condition, potentially setting the stage for a rebound if the price finds support.
Meanwhile, the 4-hour chart highlights ongoing bearish momentum with slightly less volatility.Critical levels to monitor include the lower Bollinger Bands on both charts ($0.0000155 on the daily and $0.0000157 on the 4-hour).
A drop below these levels could signal further declines, while a bounce could present a buying opportunity, particularly if the MACD starts showing bullish signals. Keeping an eye on trading volume and broader market trends will be essential for making informed trading decisions in the near future.
You can purchase Lucky Block here. Buy LBLOCK.