Lucky Block (LBLOCK) Price Analysis for November 22, 2024 – Promising Signs Amid Consolidation
Estimated Reading Time: 3 minutes
Don’t invest unless you’re prepared to lose all the money you invest. This is a high-risk investment and you are unlikely to be protected if something goes wrong. Take 2 minutes to learn more

Lucky Block (LBLOCK) is currently trading at $0.00001744, reflecting a slight dip in recent sessions. The 4-hour and daily charts indicate a consolidating phase, with price movement constrained by key resistance and support levels. Despite recent bearish momentum, there are indications of potential bullish reversals.
4-Hour Chart Analysis: Signs of Stability Emerging
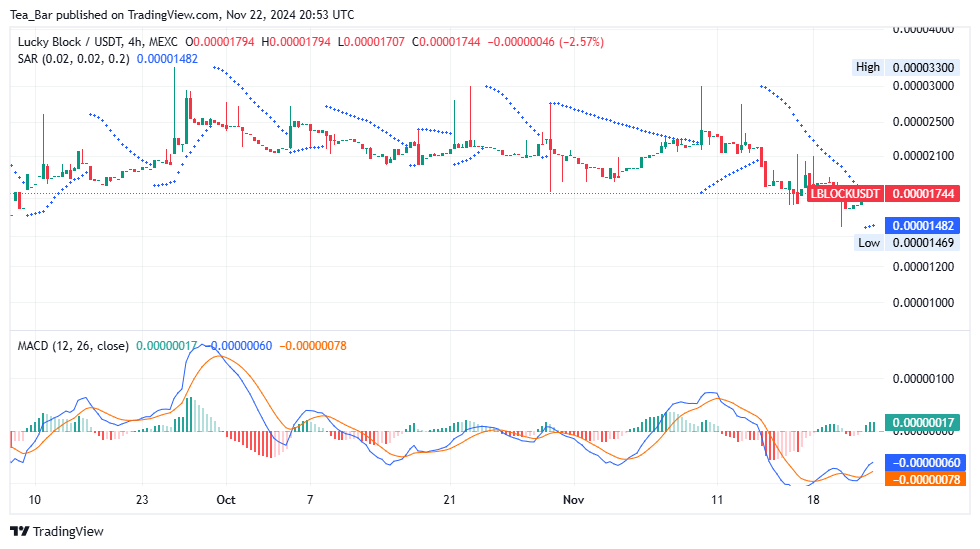
On the 4-hour chart, LBLOCK’s price has found support near $0.00001482, with Parabolic SAR dots above the price suggesting short-term bearish sentiment. However, the MACD indicator shows narrowing bearish histograms, indicating weakening selling pressure. If this trend continues, a crossover of the MACD line above the signal line could confirm a potential bullish reversal.
The immediate resistance at $0.00001794 is crucial. A break above this level could pave the way for LBLOCK to target higher zones around $0.00002000, marking a significant recovery in the short term.
Daily Chart Analysis: Mid-Term Potential Remains Bright
On the daily timeframe, LBLOCK’s Parabolic SAR confirms a prevailing bearish trend, with the dots positioned above the candles. However, the MACD histogram is exhibiting reduced bearish momentum, hinting at the possibility of price stabilization.
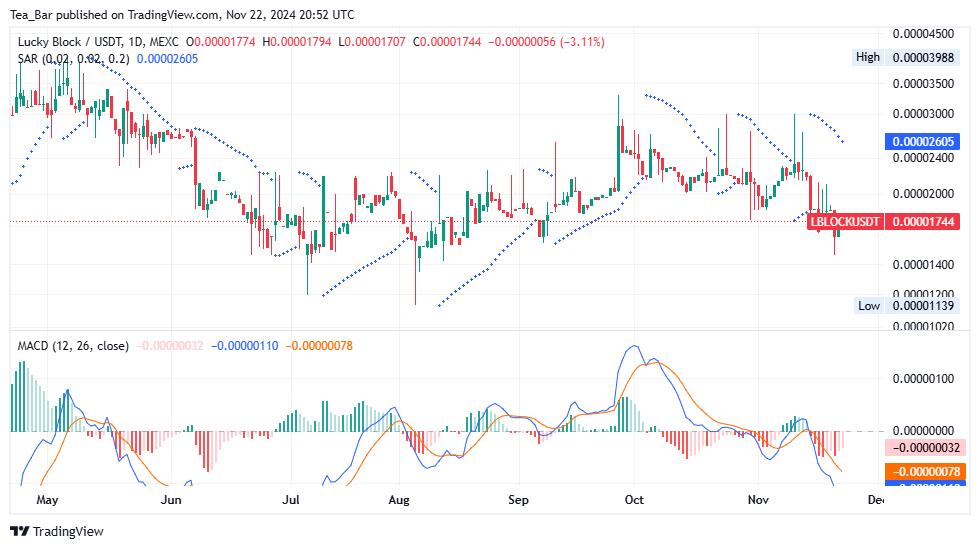
The support level of $0.00001139 is a critical zone that has historically attracted buying interest. On the upside, resistance at $0.00002605 remains a key target for mid-term recovery. A sustained push above this level could signify renewed bullish momentum, driving LBLOCK toward the $0.00003000 range.
A Positive Outlook with Recovery Potential
While Lucky Block has faced some downward pressure recently, the indicators suggest that selling momentum is tapering off. Short-term traders should monitor the MACD on both the 4-hour and daily charts for bullish crossovers, as these could signal a potential trend reversal.
For long-term holders, LBLOCK’s price consolidation near critical support levels is an encouraging sign of strength and resilience, setting the stage for a rebound in the coming sessions. A break above resistance levels could spark renewed investor confidence, pushing LBLOCK toward significant recovery milestones.
You can purchase Lucky Block here. Buy LBLOCK.