Lucky Block (LBLOCK) Price Analysis for October 10: Signs of Resurgence Amid Stability
Estimated Reading Time: 3 minutes
Don’t invest unless you’re prepared to lose all the money you invest. This is a high-risk investment and you are unlikely to be protected if something goes wrong. Take 2 minutes to learn more

Lucky Block (LBLOCK) is currently trading at $0.00002273, experiencing a minor gain of 0.04% today. While the broader crypto market faces fluctuating trends, LBLOCK continues to hold strong, displaying resilience and offering potential for positive movement ahead. Investors and traders are keeping a close watch as the token stabilizes. In this analysis, we explore how LBLOCK is positioned in both the daily and 4-hour charts and what its outlook could be moving forward.
Daily Chart: LBLOCK Consolidates with Bullish Momentum on the Horizon
The daily chart reflects encouraging signs of strength for LBLOCK, which has managed to hold steady around a support level of $0.00001139. The Parabolic SAR dots are currently below the price action, indicating an ongoing upward trend that could continue if support holds firm. Additionally, although the MACD line is near a potential bearish crossover, it has yet to confirm this, leaving room for a potential reversal in the upward direction. Key resistance levels to watch are at $0.00003125, and if breached, LBLOCK could reach its next major resistance at $0.00003300.
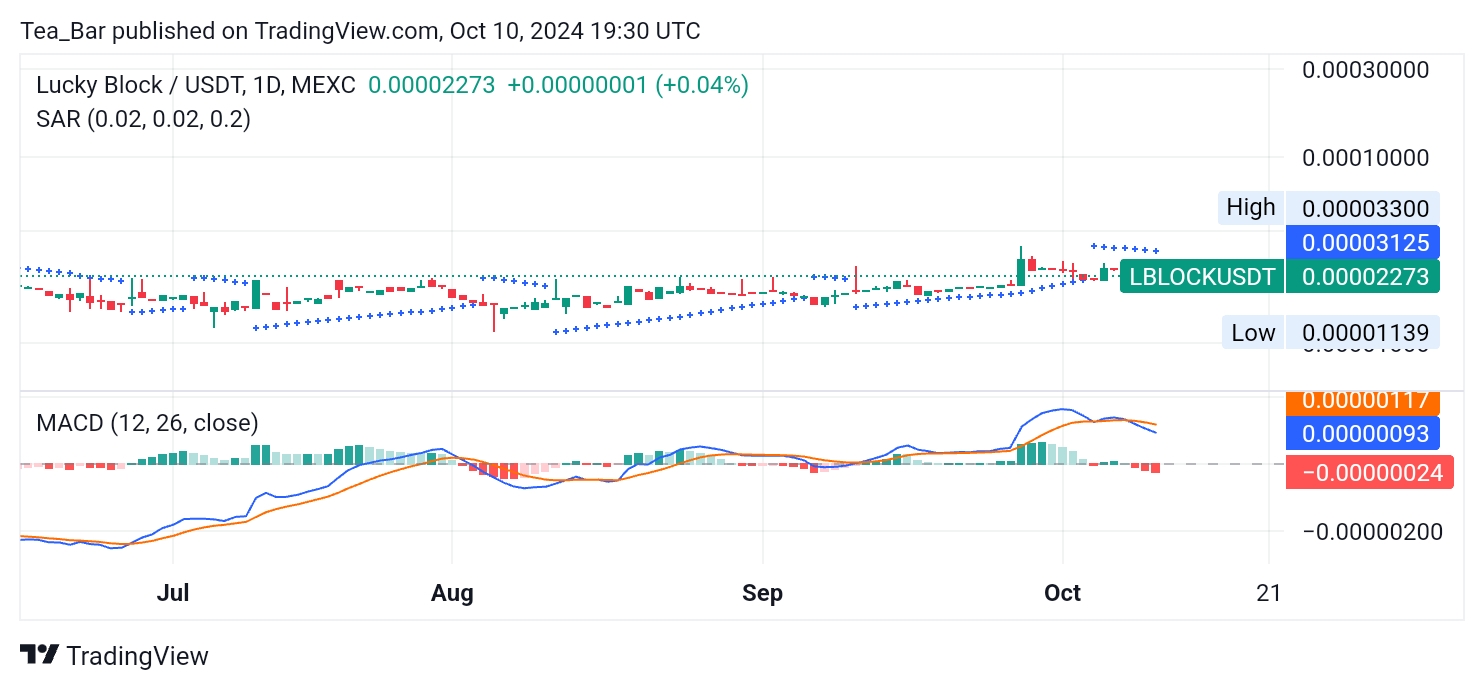
Despite short-term uncertainties, the token’s stability over recent weeks, combined with bullish technical indicators, suggests that LBLOCK may soon be due for an upward push. Traders should monitor the MACD closely for confirmation of the direction.
4-Hour Chart: Short-Term Fluctuations with Positive Momentum Potential
On the 4-hour chart, LBLOCK demonstrates short-term volatility, yet remains well-supported at $0.00002100. The Parabolic SAR in this time frame is showing mixed signals, with dots fluctuating above and below price action. This reflects market indecision, but the MACD is hinting at a potential recovery, despite being in negative territory. As the price consolidates, a move above $0.00002604 could trigger renewed buying interest, pushing LBLOCK towards the $0.00003300 target seen in the daily chart.
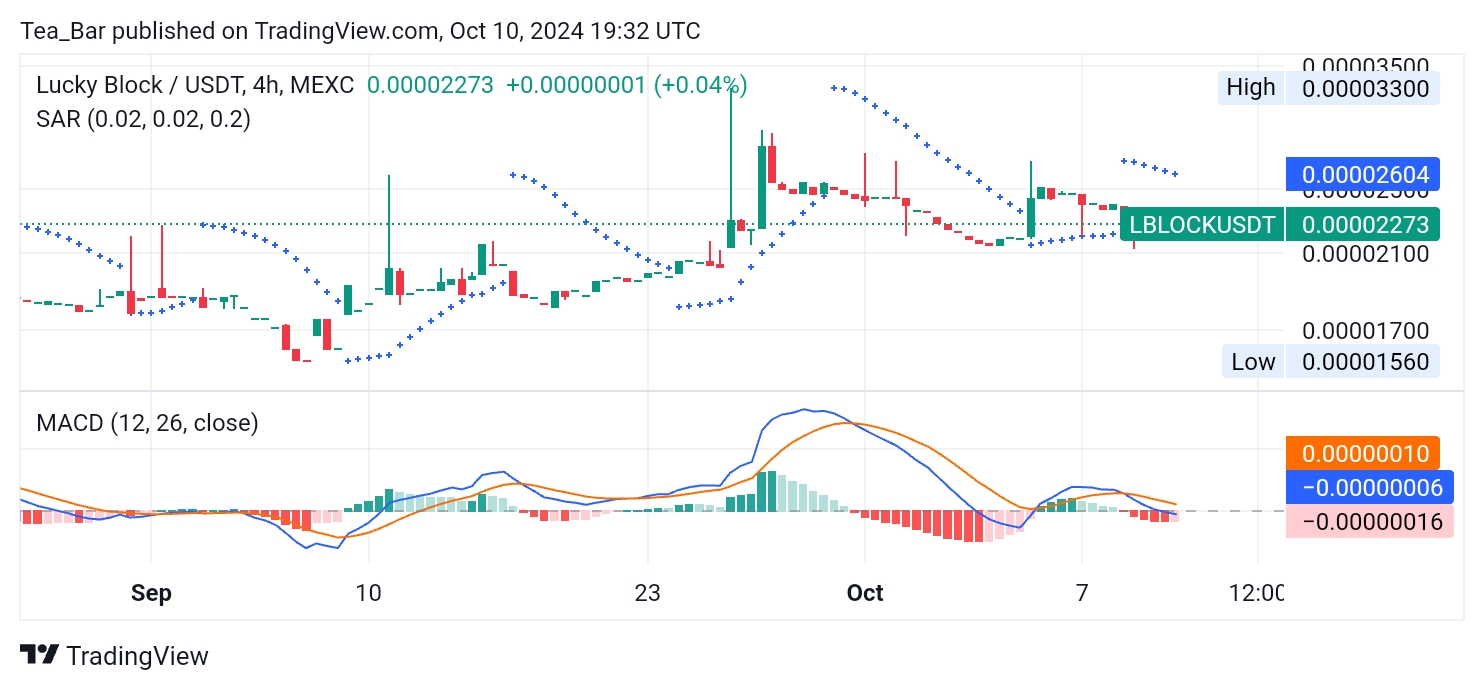
LBLOCK’s price action in shorter time frames indicates that the token is still vulnerable to swings, but the underlying strength of support levels presents opportunities for upside, particularly if market conditions stabilize.
Future Outlook: LBLOCK Poised for Further Upside Potential
Looking forward, LBLOCK shows positive signs that a breakout may be imminent. The token is holding firm at critical support around $0.00002100 and is eyeing resistance levels at $0.00002604 and $0.00003125. If these levels are surpassed, LBLOCK could push towards its high of $0.00003300, indicating a strong upward trend. The recent market momentum for LBLOCK reflects its capacity to withstand volatility, making it a favorable option for traders seeking growth opportunities in the meme coin sector.
As LBLOCK continues to display resilience, investors should look for signals of a bullish breakout. Should key resistance levels be broken, the token could make significant strides towards reclaiming higher price points, with a potential rally on the horizon.
You can purchase Lucky Block here. Buy LBLOCK.