$SPONGE (SPONGE/USD) Gears Up for Further Movement Near $0.00093
Don’t invest unless you’re prepared to lose all the money you invest. This is a high-risk investment and you are unlikely to be protected if something goes wrong. Take 2 minutes to learn more

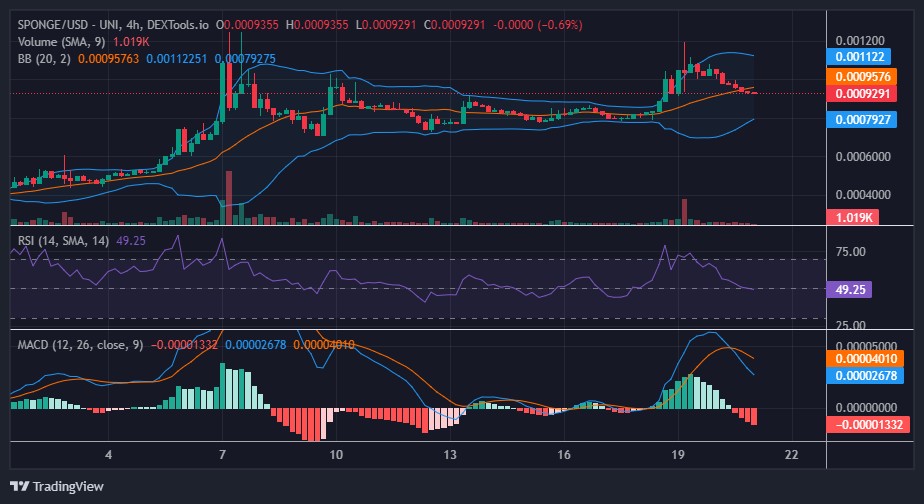
In the past week, the SPONGE/USD market has displayed noteworthy bullish performance. Particularly on January 19, during the 7th hour, bullish sentiment notably strengthened, reaching a peak of $0.0012. Subsequent to this high, the market underwent a significant retracement, triggered by substantial profit-taking activities at the $0.0012 level.
As the price approaches the $0.0093 level, identified as the most recent support level, the bearish market action appears to be leveling off. Presently, with the market having reached the support level, the price action has become relatively stagnant.
Key Market Dynamics:
- Resistance Levels: $0.0010, $0.0011, and $0.0012.
- Support Levels: $0.000450, $0.00040, and $0.00035.
Comprehensive Technical Analysis for $SPONGE (SPONGE/USD):
The ongoing SPONGE/USD trading session is characterized by a four-price doji, indicating a significant level of indecision in the market. The presence of this candlestick pattern near a crucial support level suggests a potential reversal in the price. If the market manages to assert dominance at this level, it could pave the way for surpassing the $0.0012 price threshold.
Observing the indicators, both the Bollinger Bands and the Relative Strength Index (RSI) portray the market in a state of equilibrium. The Relative Strength Index indicates that market momentum is situated in the middle of the indicator, signifying a balance between bullish and bearish forces. In this scenario, there is a requirement for increased bullish efforts to achieve their target, given the equilibrium in market momentum.
Insights from the 1-Hour Perspective:
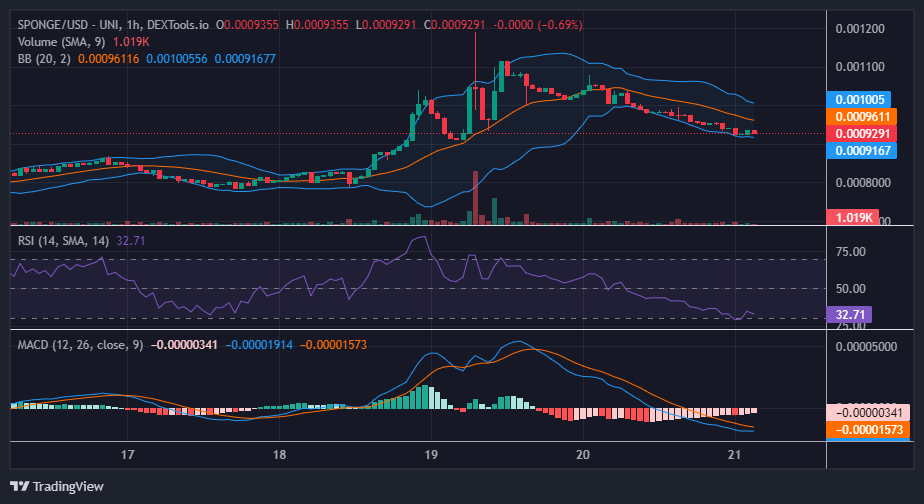
Upon close examination of the market from the 1-hour timeframe perspective, a bullish divergence becomes apparent. Despite the downward trend in the price action, the Moving Average Convergence and Divergence (MACD) displays pale-colored histograms with diminishing heights. Interestingly, as the bearish market experiences significant movement, the trade volume fails to generate substantial histograms. These market dynamics suggest a potential reversal of price action in a bullish direction.
The roadmap for SpongeV2 is jam-packed with cutting-edge innovations and growth objectives.
#SpongeV2‘s roadmap is packed with innovative features and expansion plans. 🚀
Did someone say bigger and better exchanges? 🙌
Don’t get left behind. ⚡️ $SPONGE #Web3 #Crypto #Altcoins pic.twitter.com/NsvgQpbeaT
— $SPONGE (@spongeoneth) January 21, 2024
Invest in the hottest and best meme coin. Buy Sponge ($SPONGE) today!


