Chainlink Is Circling above $7.50 but Faces an Additional Drop
Estimated Reading Time: 2 minutes
Don’t invest unless you’re prepared to lose all the money you invest. This is a high-risk investment and you are unlikely to be protected if something goes wrong. Take 2 minutes to learn more
Chainlink (LINK) Long-Term Analysis: Bearish
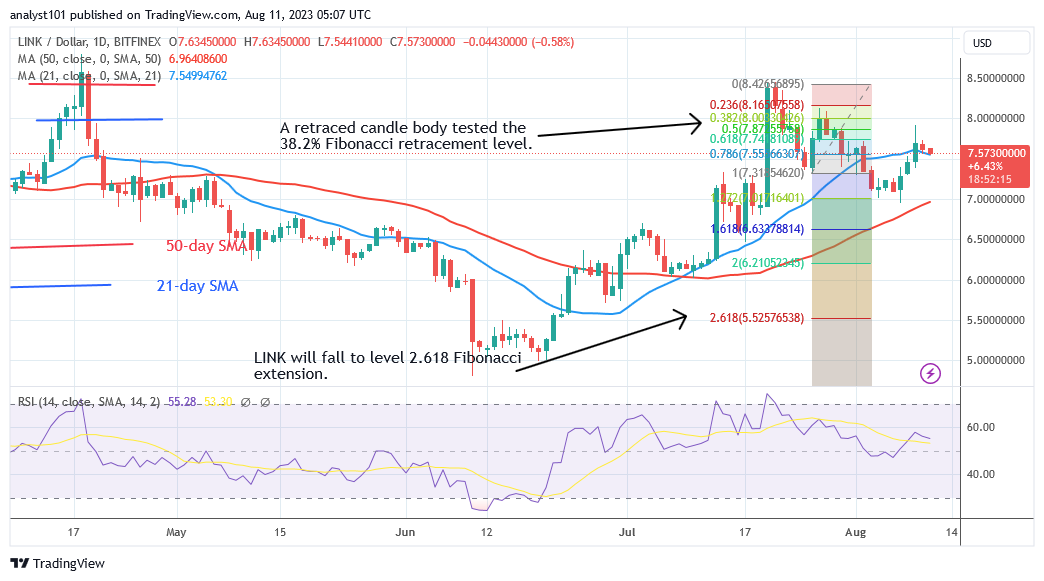
Chainlink (LINK) price is correcting higher but faces an additional drop. The upward corrective has been rebuffed today at the $8.00 resistance level. The crypto’s price is hovering above the 21-day SMA and the 50-day SMA. The cryptocurrency will be compelled to make a range-bound move if it is trapped between the moving average lines.
Meanwhile, the price indicator has predicted a further decline of the cryptocurrency. The cost of LINK dropped to $7.31 on July 26 before rising. A candle body that had retraced tested the 38.2% Fibonacci retracement level. The correction is anticipated to cause Chainlink to drop to the 2.618 Fibonacci extension level, or $5.52.
Technical indicators:
Major Resistance Levels – $8.00, $10.00, $12.00
Major Support Levels – $6.00, $4.00, $2.00
Chainlink (LINK) Indicator Analysis
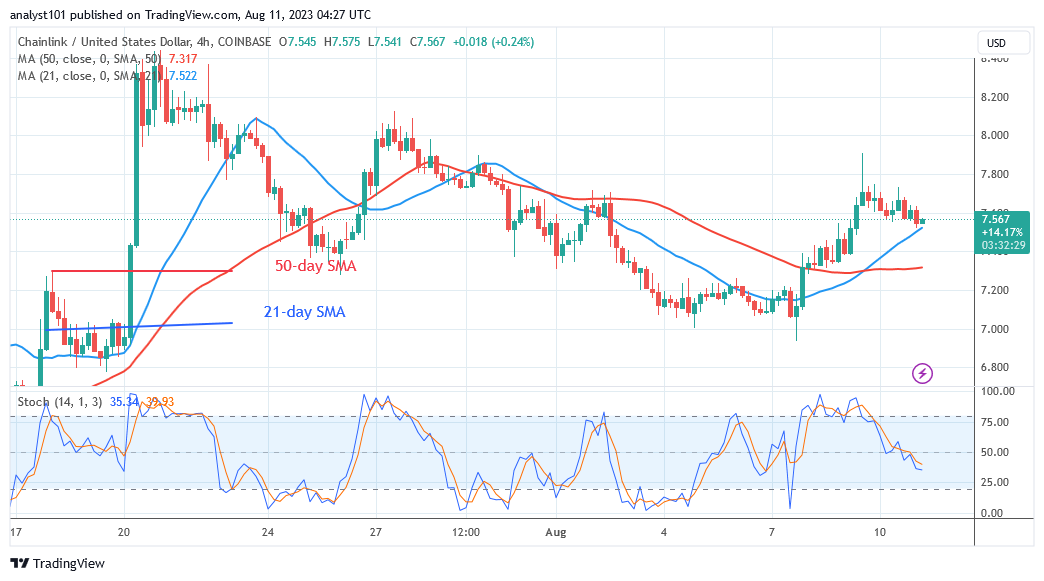
Chainlink is correcting upward at the Relative Strength Index period 14 level of 55. The upward correction has failed as long as price bars remain above the moving average lines. The alternative cryptocurrency will be compelled to move inside the moving average lines’ range.
If the price falls below the moving average lines, selling pressure will resume. The LINK price is in a bearish momentum below level 50 of the daily Stochastic.
What Is the Next Direction for Chainlink (LINK)?
Chainlink is declining after the upward correction but faces an additional drop. The price will get closer to the low of the 2.618 Fibonacci extension, or $5.52, if it drops below the moving average lines. LINK/USD is currently trading above the 21-day simple moving average, which suggests a likely decline.
You can purchase crypto coins here. Buy LBLOCK
Note: Cryptosignals.org is not a financial advisor. Do your research before investing your funds in any financial asset or presented product or event. We are not responsible for your investing results