Litecoin (LTC) Price Prediction: LTC/USDT Lurks Below Key Levels
Estimated Reading Time: 2 minutes
Don’t invest unless you’re prepared to lose all the money you invest. This is a high-risk investment and you are unlikely to be protected if something goes wrong. Take 2 minutes to learn more

Date: November 18, 2025
The Litecoin market has continued to stay subdued despite the bullish flashes seen in the ongoing session. Trading activity in the market has continued to dwell below important technical levels. As such, there may just be only short-term opportunities in the market.
LTC/USDT Long-Term Trend — Bearish (Daily Chart)
Key Price Levels
Resistance: $95, $100, $105
Support: $90, $85, $80
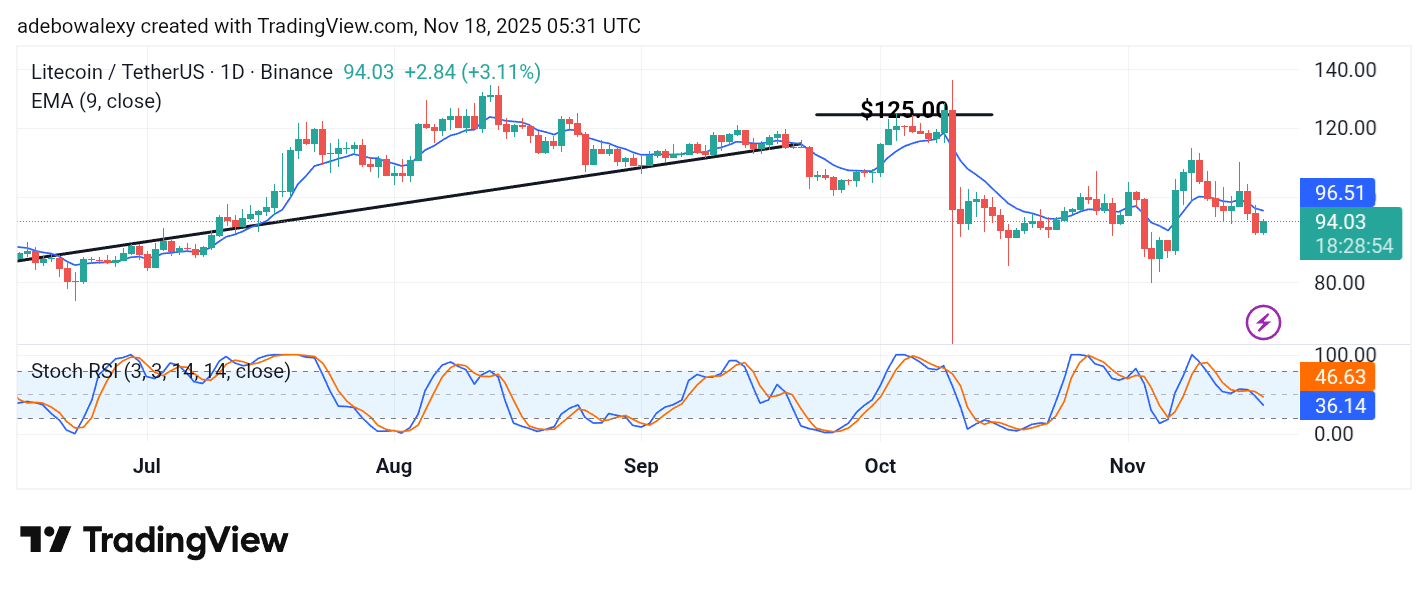
Trading activity in the Litecoin daily price chart remains predominantly bearish. However, the ongoing session has presented a bit of an upward rebound. Nevertheless, price action remains under the 9-day Exponential Moving Average (EMA) line. Similarly, the lines of the Stochastic Relative Strength Index (SRSI) indicator are still diving toward the oversold region despite the modest upward rebound.
Litecoin (LTC) Price Prediction: LTC/USDT May Descend to the $90 Mark
In general, price movement as well as trading indications arising from the Litecoin market continue to suggest that price action largely remains in a downtrend. The corresponding price candle to the ongoing session is a green one and, as such, presents a bit of upside rebound.
However, it only appears following a strong downward price movement. As such, trading remains below the 9-day EMA line and at a notable distance. The lines of the applied SRSI indicator can also be seen descending further into the oversold region. Consequently, this affirms that upside forces are limited and prices may continue edging lower.
Litecoin (LTC) Price Prediction: LTC/USDT Keeps Modest Upside Movement (4-Hour Chart)
Price action in the Litecoin 4-hour chart has continued an upward movement for two sessions straight. The last price candle here is testing the ceiling formed by the 9-day EMA curve.
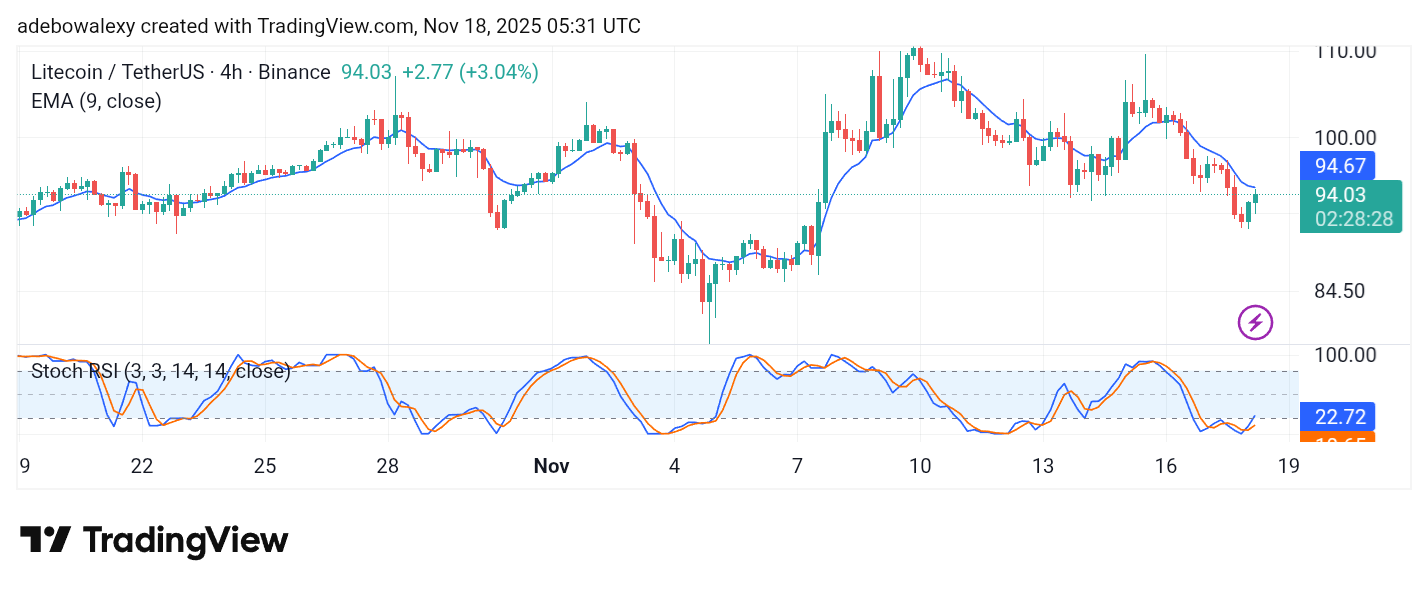 Similarly, the lines of the SRSI indicator are still rising upward from the oversold region following an upside crossover there. As such, this suggests that there might be short-term opportunities in this market. Albeit, Traders should maintain caution as they aim at the $96 mark for short-term profits.