Litecoin (LTC/USD) Increases Energy past the Key $240 Resistance Trading Point
Estimated Reading Time: 3 minutes
Don’t invest unless you’re prepared to lose all the money you invest. This is a high-risk investment and you are unlikely to be protected if something goes wrong. Take 2 minutes to learn more
Litecoin Price Prediction – April 13
The market valuation of LTC/USD has experienced an increase in its current third bid to have a more sustainable upward trading outlook as of writing.
LTC/USD Market
Key Levels:
Resistance levels: $280, $300, $320
Support levels: $220, $200, $180
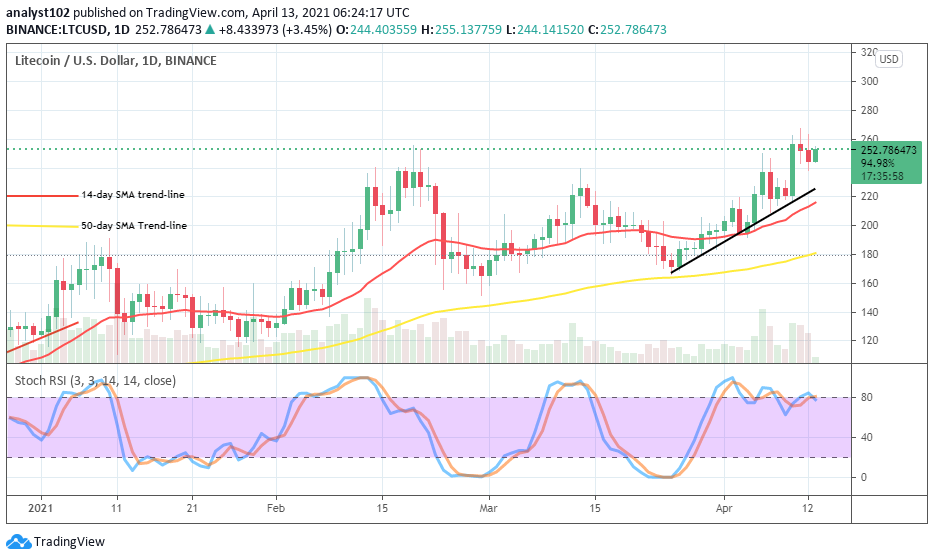
LTC/USD – Daily Chart
The present trade picture of the LTC/USD daily chart shows another form of straight-line path to the north to indicate the prevalence of a bullish move in the market. Both the bullish trend-line and the 14-day SMA trading indicator are close in location on the chart pointing to the north from the current price trading zone. The 50-day SMA trend-line is placed at a $180 level far below them to also point towards the north direction. The Stochastic Oscillators have continued to move in a consolidation style around range 80 closer to the overbought region. All these indicate that the crypto pairs journey to the moon has not fully exhausted.
Will the LTC/USD market still hold strong above the $240 resistance line?
As the LTC/USD price now trades in a consolidation-moving manner, the bulls are expected to continue to make the best use of it to push more further to higher levels. Meanwhile, trading levels of $240 and $220 will be playing determinant factors in the continuation of the bullish trend. However, the crypto-economy may witness a line of variant higher lows around the values of $240 and $260 in the event of price resuming a prolonged fluctuation around the present trading high point.
As regards the economic melt-down move of this market, the bears need to exercise some degree of patience to see an area where price tends to form some convergences at a high trading zone before considering launching a sell position. The current slight price rejection at the $260 line does not yet appear to suggest the early intervention of the selling situation of the LTC/USD market.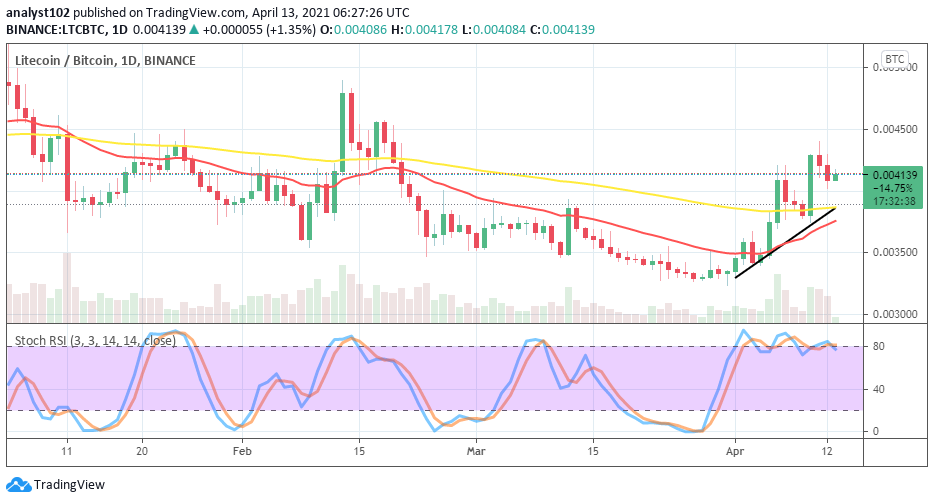
LTC/BTC Price Analysis
It is still depicted that in about a week coupled with some days of a trading session, the purchasing power of LTC has relatively increased as compared with BTC’s. Nevertheless, the counter crypto still keeps the bearish outlook to some extent against the base crypto until the present. The 50-day SMA trading indicator now briefly points towards the east as the 14-day SMA trend-line points to the north close below it. The Stochastic oscillators are moving in a consolidation formation around range 80 near the overbought region. That indicates that the base instrument is in control of the market space to an extent.
Note: cryptosignals.org is not a financial advisor. Do your research before investing your funds in any financial asset or presented product or event. We are not responsible for your investing results.