Sustaining the Surge: Analyzing Skale Network’s (SKLUSD) Recent Volatility Increase
Estimated Reading Time: 2 minutes
Don’t invest unless you’re prepared to lose all the money you invest. This is a high-risk investment and you are unlikely to be protected if something goes wrong. Take 2 minutes to learn more
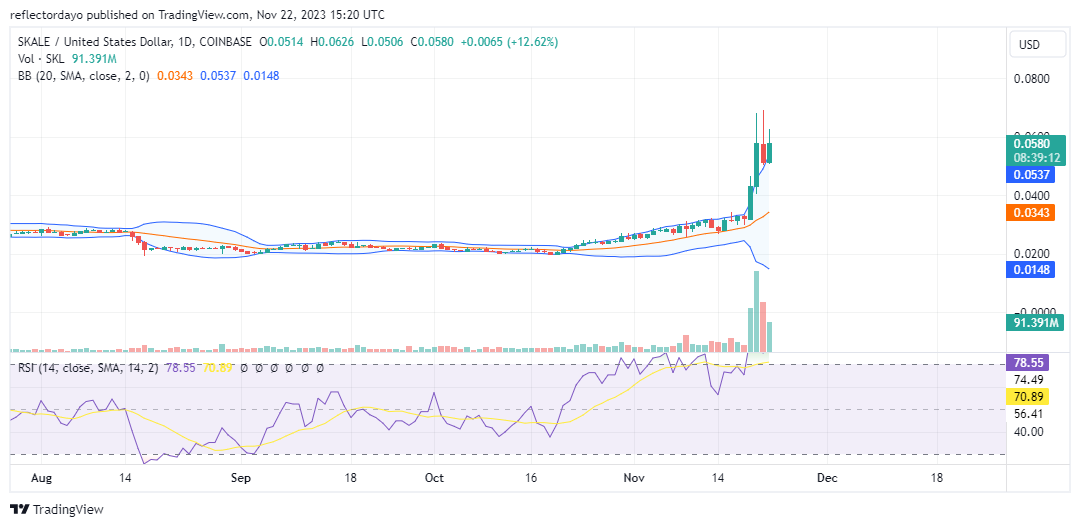
The dynamics of the Skale market underwent a significant shift on November 19th, when a pronounced surge in upward volatility occurred. Within a span of four days, the market ascended from the $0.0316 price level to surpass the $0.05 price level. Presently, the prevailing market trends are conducive to bullish sentiments, and it appears that market participants favoring bullish positions are adeptly leveraging the existing volatility. Notably, a higher support level has been established in the current market development.
Skale Network Market Data
- SKL/USD Price Now: $0.0575
- SKL/USD Market Cap: $282,396,855
- SKL/USD Circulating Supply: 5,000,811,004 SKL
- SKL/USD Total Supply: 5,447,166,667 SKL
- SKL/USD CoinMarketCap Ranking: #133
Key Levels
- Resistance: $0.060, $0.065, and $0.070.
- Support: $0.040, $0.035, and $0.030.
The Skale Network Price Forecast: Analyzing the Indicators
Following Skale Network’s attainment of its annual peak at $0.07 in February, the market underwent an extended period of price consolidation. Substantial changes were initiated in the latter part of October, where, despite a relatively low volume of trade, the market exhibited a steady progression toward a bullish trajectory. Bollinger Bands illustrated an ascending price channel during this period. Notably, around November 19, the bull market intensified its momentum, propelling prices above the $0.050 threshold.
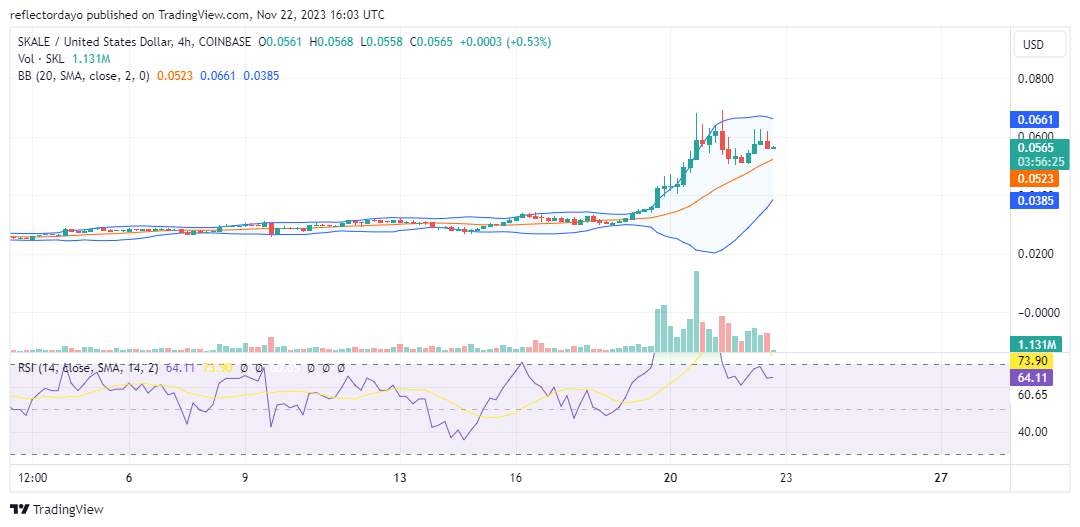
SKL/USD 4-Hour Chart Outlook
As trade volume subsided, the price action exhibited consolidation around the $0.06 price level. In the current market scenario, bears are facing upward pressure despite promptly establishing resistance at the $0.06 price level. The emergence of an ascending wedge triangle pattern suggests an impending bullish price breakout.