Litecoin (LTC/USD) Market Is Preparing a Baseline Building Cycle
Estimated Reading Time: 3 minutes
Don’t invest unless you’re prepared to lose all the money you invest. This is a high-risk investment and you are unlikely to be protected if something goes wrong. Take 2 minutes to learn more
Litecoin Price Prediction – April 25
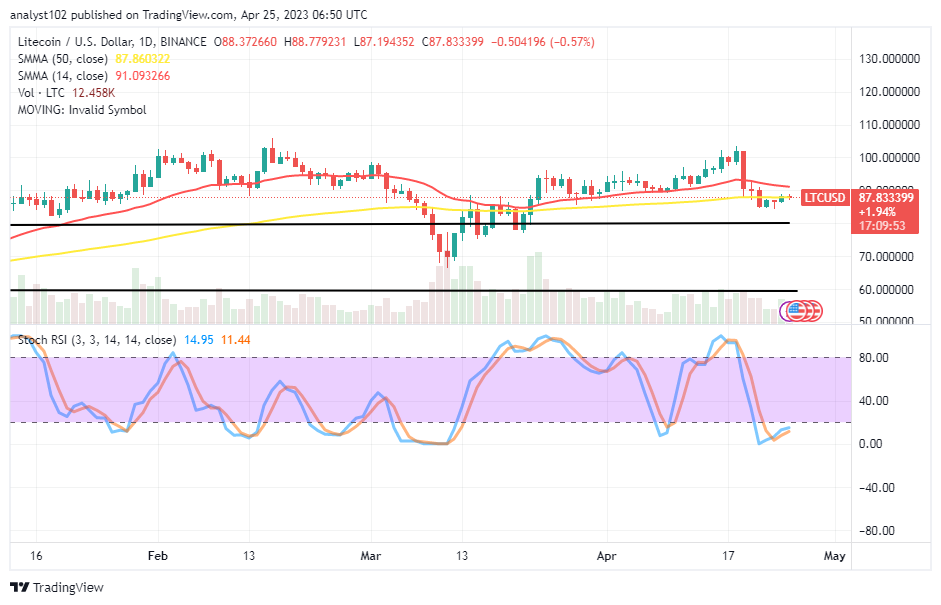
A significant dropping situation in the LTC/USD trade from around $100 toward the support of $80 as the crypto market is preparing a baseline building cycle. After a slight increase from a low point reached at $87.194352, the price has been trading around $87.833399, with a high-value line around $88.779231 at a 0.57 percent negative. A sequence of lesser lows may appear to average the most recent position and quickly produce a bounce-off.
LTC/USD Market
Key Levels:
Resistance levels: $95, $105, $115
Support levels: $80, $75, $70
LTC/USD – Daily Chart
The LTC/USD daily chart showcases the crypto market is preparing a baseline building cycle over the upper range line drawn alongside the $80 support level. The 14-day SMA trend line is around $91.093266 above the $87.860322 point of the 50-day SMA trend line. The Stochastic Oscillators are in the oversold region at 11.44 and 14.95 levels. There may be a continual pause-trading session to prolong, maintaining stances at almost the same pace.
How much room is there for further declines in the LTC/USD market below the $80 support level?
It’s looked like another round of attempts to swing upward from the point of the $80 line may experience further lows not to keep longer than unnecessary as the LTC/USD market is preparing a baseline building cycle. The divergence of candlesticks that surfaced over the past few days has indicated a potential halt to losses soon.
Shorting positions, placing further from the present spot, will be a risk according to the LTC/USD technical analytics because it has been a while since the price has been indecisive at the lower axis. And the Stochastic Oscillators have indicated a sizeable reduction in the downward trend. As of this moment of this piece, shorting activities needed to suspend even though some remains of falling forces could show up to cause a trap for bears in no time.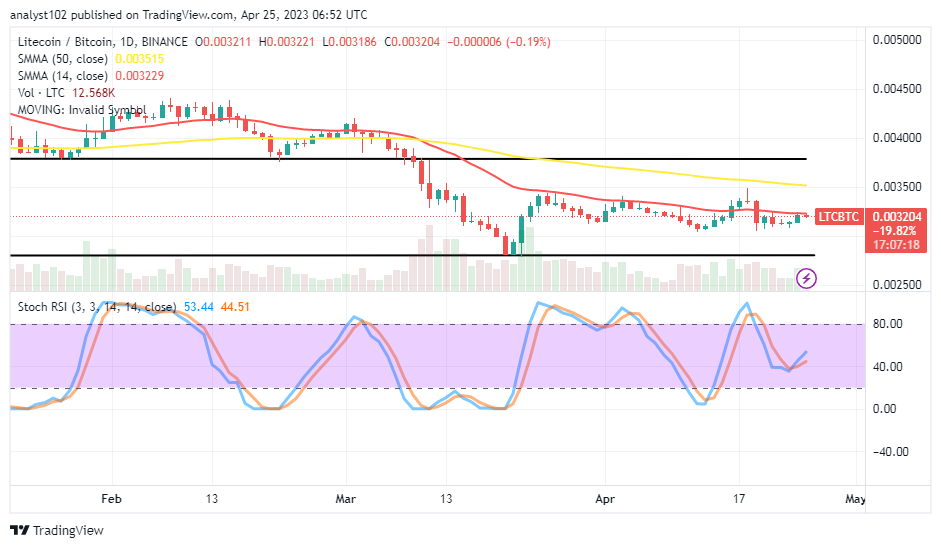
LTC/BTC Price Analysis
In contrast, Litecoin has been swinging in a range-bound path around the trend of the smaller SMA against the trending force of Bitcoin. The 14-day SMA indicator is underneath the 50-day SMA indicator. The upper and the lower trend lines are in place, embodying the trading session over a long time. The Stochastic Oscillators have traversed southbound from an overbought region, trying to cross back their lines northbound at 44.51 and 53.44 levels.
Note: Cryptosignals.org is not a financial advisor. Do your research before investing your funds in any financial asset or presented product or event. We are not responsible for your investing results.
You can purchase Lucky Block here. Buy LBLOCK