Lucky Block Awakens: LBLOCK Sets the Stage for a Bullish Comeback – July 22, 2025 Outlook
Estimated Reading Time: 3 minutes
Don’t invest unless you’re prepared to lose all the money you invest. This is a high-risk investment and you are unlikely to be protected if something goes wrong. Take 2 minutes to learn more

Lucky Block (LBLOCK) continues to display resilience and quiet strength, holding firm around the $0.00004225 mark despite market-wide fluctuations. With positive signs developing on both the daily and 4-hour timeframes, the token appears to be preparing for its next upward phase. Investors are now watching closely to see whether this consolidation will soon break toward the higher resistance levels visible on the charts.
Daily Chart: Bulls Quietly Reclaim Ground
The daily chart for LBLOCK reveals an encouraging narrative. After a sharp retracement in June, the price has since stabilized and is now gradually trending upward. The Parabolic SAR dots have flipped beneath the price action, a bullish signal that typically implies upward momentum is gaining traction. The MACD also paints a promising picture, with the MACD line crossing above the signal line and bullish histogram bars growing steadily. These indicators suggest that Lucky Block is slowly regaining positive momentum and could be setting the stage for a more defined rally.
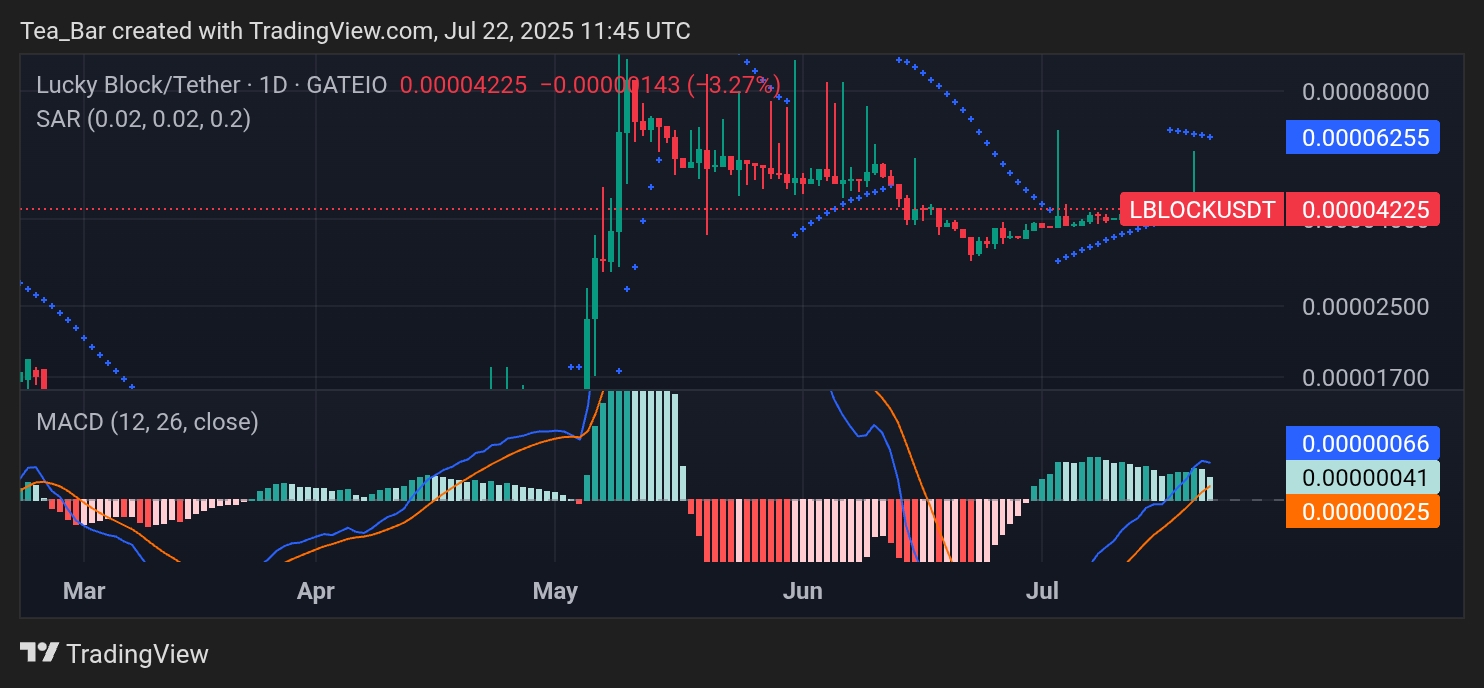
With a recent high of $0.00006255 and current price at $0.00004225, there’s ample headroom for potential appreciation. Sustained price action above the SAR support zone and a widening MACD spread could be the fuel needed to retest resistance around $0.000062 or even $0.000080 in a favorable scenario.
4-Hour Chart: Gathering Momentum Beneath the Surface
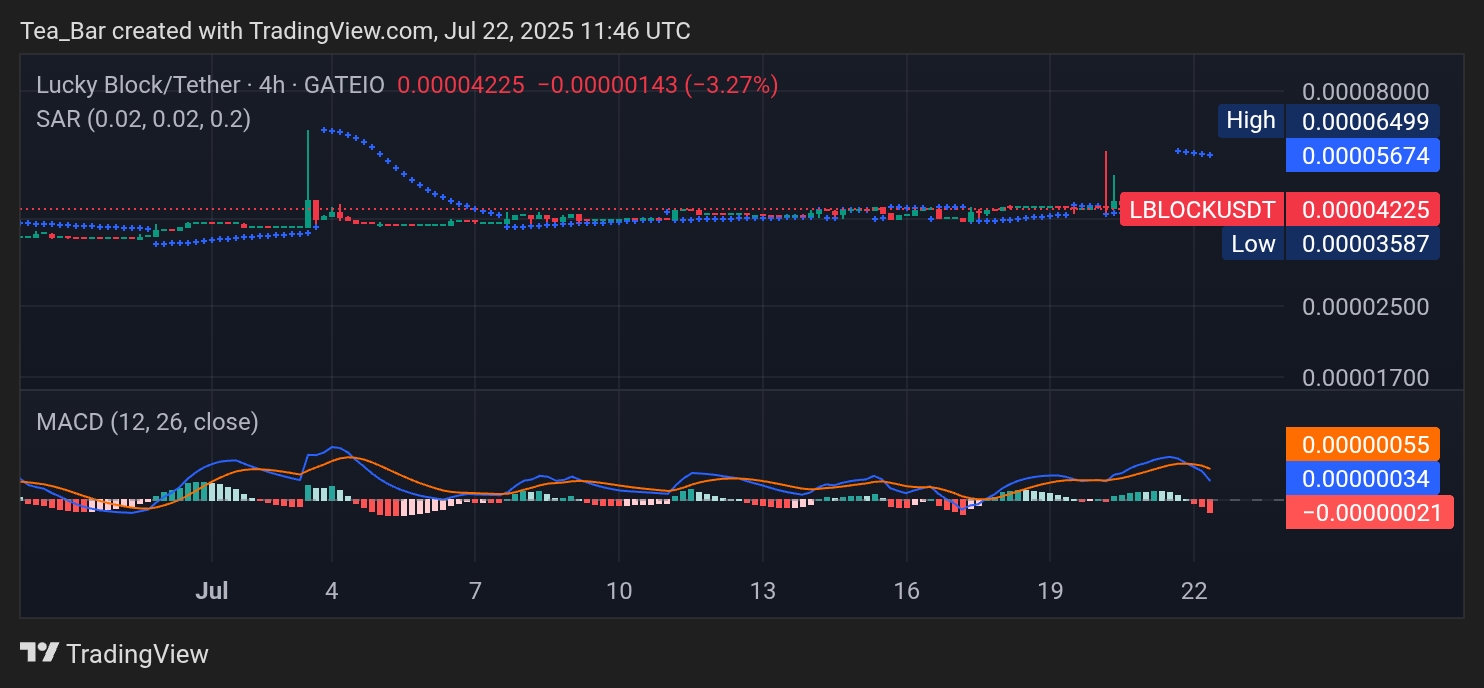
Zooming into the 4-hour chart, Lucky Block shows signs of building strength beneath its relatively flat surface. While price volatility has been low, the asset has managed to form a stable base above $0.00003587, serving as a solid support region. The MACD recently crossed bearish, but the downward histogram bars are shallow—hinting that selling pressure may already be waning.
Meanwhile, the Parabolic SAR remains above price action, but any upward movement could quickly flip this bias. If buyers step in and drive the price above $0.00004500, we may see a short-term bullish reversal that aligns with the broader daily setup. Resistance lies near $0.00005674 and $0.00006499, offering near-term targets for upward movement.
Conclusion: Lucky Block Quietly Positions for a Surge
Lucky Block appears to be building strength in the shadows, with encouraging signals emerging from both daily and 4H charts. While the market remains cautious, LBLOCK’s technical structure suggests a bullish breakout may be on the horizon. If momentum continues to build and price breaks key resistance levels, Lucky Block could soon capture renewed attention across the crypto landscape—making now a pivotal moment for early movers to take notice.
Invest wisely, and let Lucky Block’s potential work in your favor. You can purchase Lucky Block here. Buy LBLOCK.