Lucky Block (LBLOCK) Price Outlook: Gathering Strength for the Next Major Move
Estimated Reading Time: 3 minutes
Don’t invest unless you’re prepared to lose all the money you invest. This is a high-risk investment and you are unlikely to be protected if something goes wrong. Take 2 minutes to learn more

Lucky Block (LBLOCK) is currently showing signs of building strength as its consolidation phase nears completion. The token has established a solid base around key support zones, while momentum indicators suggest an approaching breakout. For investors seeking well-defined technical setups, this presents a compelling opportunity.
Daily Chart Analysis: Market Energy Ready to Unfold
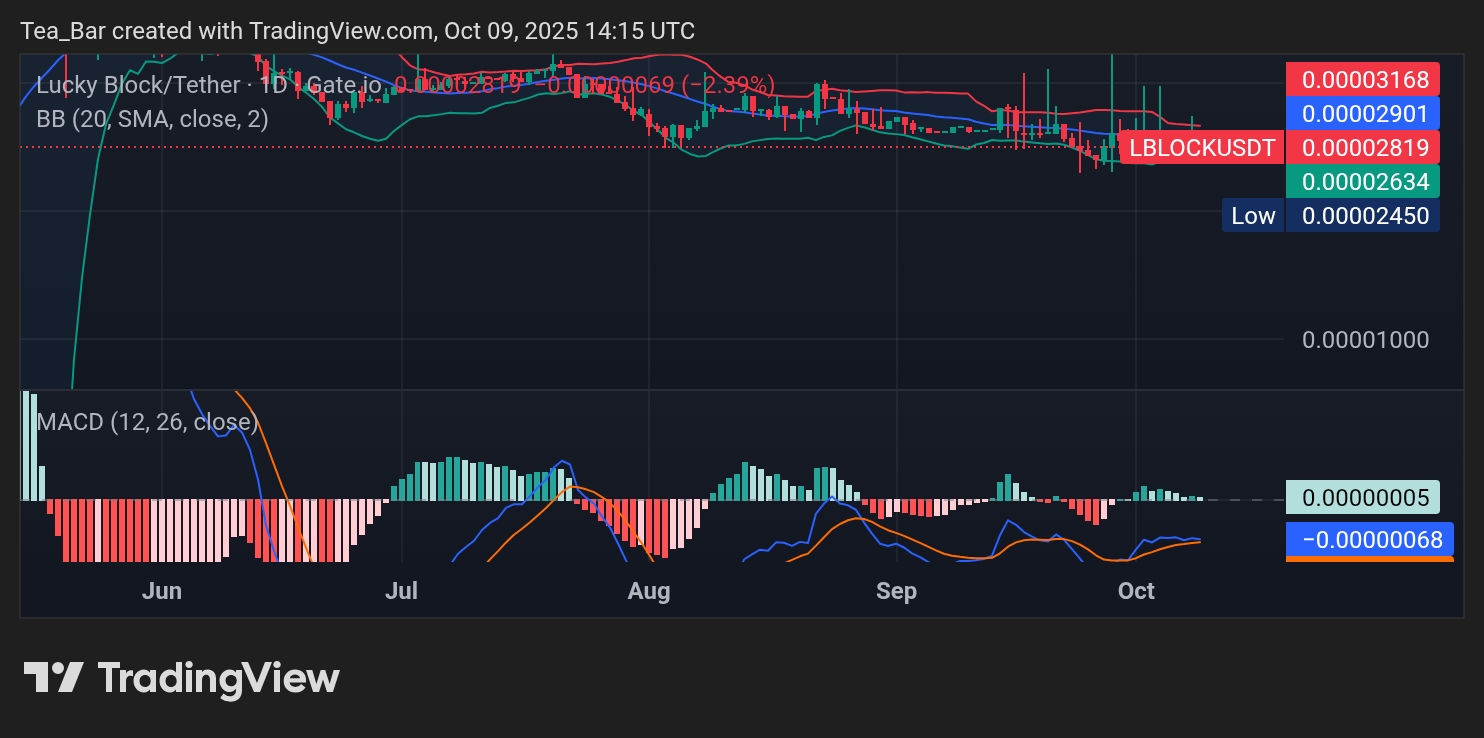
The daily chart highlights a tightening formation within the Bollinger Bands, often a precursor to heightened volatility. Meanwhile, the MACD indicator is edging closer to a bullish crossover, implying that bearish momentum is fading and that a trend reversal could be imminent.
On the upside, resistance levels lie at 0.00002901, 0.00003168, and 0.00003342. A breakout beyond these zones would likely confirm the beginning of a stronger uptrend. On the downside, firm support rests at 0.00002634, 0.00002450, and 0.00002000, providing a sturdy foundation for any renewed buying pressure.
4H Chart Analysis: Strengthening Near Key Levels
The 4-hour chart shows that the recent dip successfully retested the 0.00002734 support zone, with buyers stepping in to defend this level. This action strengthens the case for an upward continuation from here.
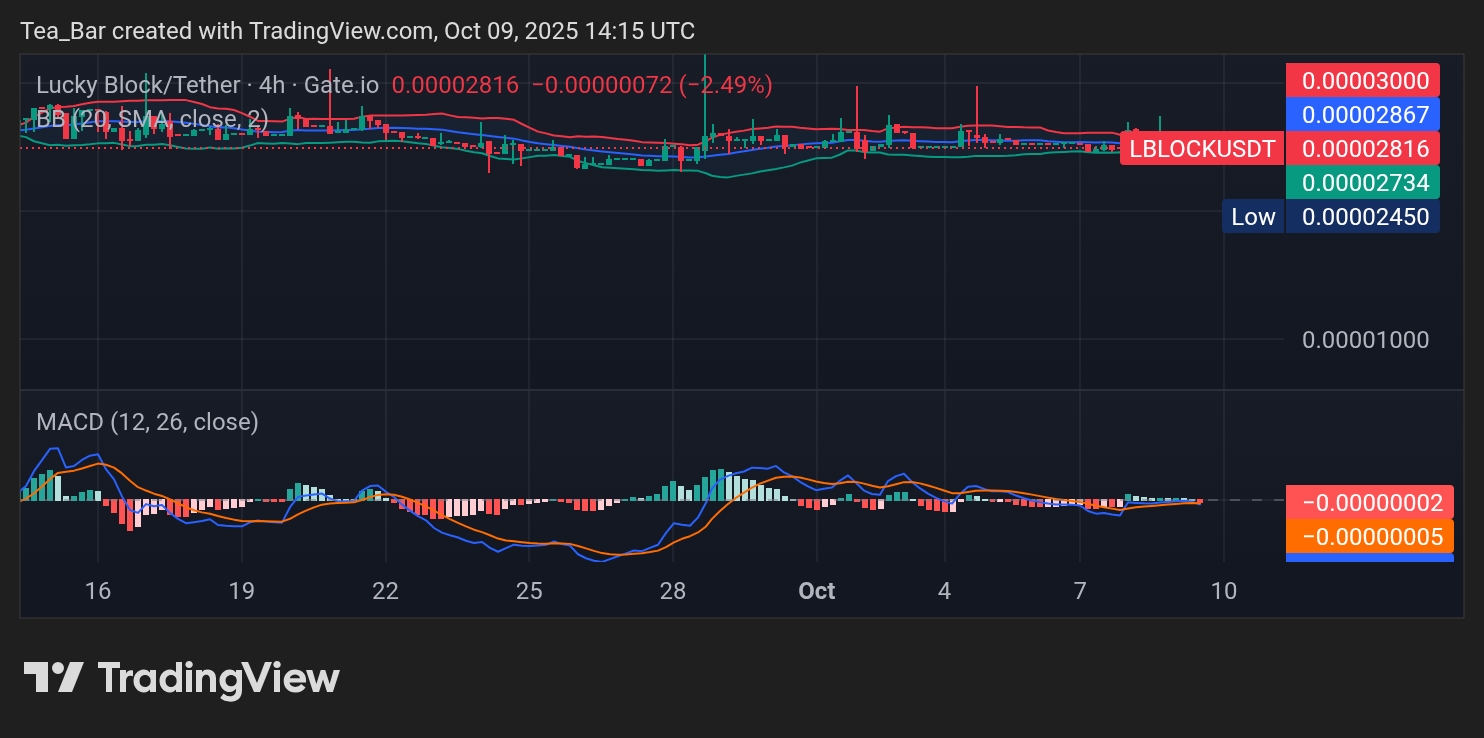
The MACD is flattening near its baseline, reflecting equilibrium between buyers and sellers. A bullish crossover would align with the daily timeframe, reinforcing the potential for a strong rally. Short-term resistance stands at 0.00002899, 0.00003000, and 0.00003204—key zones to monitor as momentum builds.
A Promising Setup with Defined Risk and Reward
Lucky Block appears well-positioned for a decisive move. The combination of a Bollinger Band squeeze, supportive MACD structure, and firm technical support creates favorable conditions for a potential breakout. With well-defined resistance and support levels, LBLOCK offers a balanced risk-to-reward outlook, suggesting an encouraging setup for traders watching its next move.
Invest wisely, and let Lucky Block’s potential work in your favor. You can purchase Lucky Block here. Buy LBLOCK.