Battle Infinity Market Forecast: IBAT Tugs at the Resistance Level Persistently
Estimated Reading Time: 3 minutes
Don’t invest unless you’re prepared to lose all the money you invest. This is a high-risk investment and you are unlikely to be protected if something goes wrong. Take 2 minutes to learn more


Free Crypto Signals Channel
Battle Infinity Market Forecast – September 27
Battle Infinity market forecast is for the price to continue tugging at the resistance level till it finds a weak point and pushes upward from there.
IBAT/USD Long-Term Trend: Bullish (1-Hour Chart)
Key Levels:
Supply Zones: $0.0039470, $0.0034340
Demand Zones: $0.0030010, $0.0026560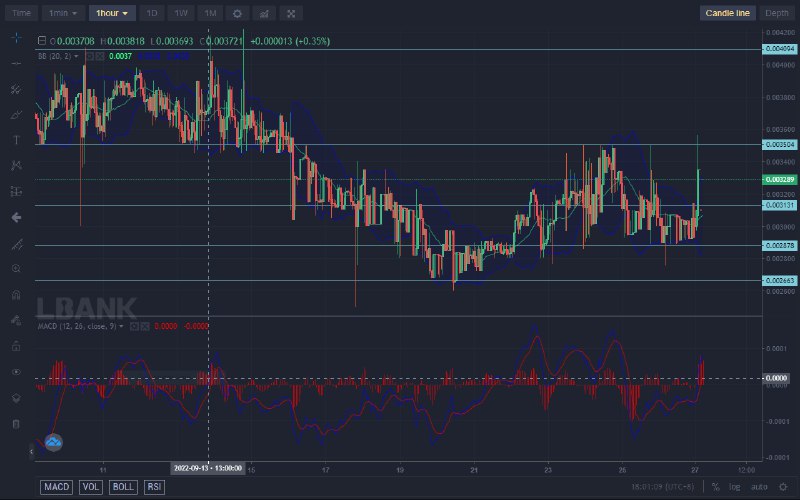
Battle Infinity currently has a very bullish orientation. The bulls keep tugging at the resistance level to find points of weakness by which the market will push upward. After testing the resistance on the 25th and the 26th, the price has also risen to test the resistance level today again. The price is ready to drive upward at every opportunity.
Battle Infinity Market Forecast: IBAT Is Strongly Bullish
IBAT is aiming to continue its upward movement from the $0.0028780 support level. The market rose to this current level after it put a stop to the downtrend at the $0.0026630 support level.
The coin has tugged at the resistance level for two consecutive days now, and it is expected that this persistence will eventually help the market reach higher price levels.
The movement of the MACD (Moving Average Convergence Divergence) beyond the zero level is in agreement with the current bullish intent of the market. The latest candlestick has pierced the upper Bollinger Band as a result.
IBAT/USD Medium-Term Trend: Bullish (15-minute chart)
On the 15-minute chart, the price can be seen as undulating in a channel. The $0.0035040 key level is acting as the resistance and the $0.0028780 is acting as a support level. The market can be seen to be tugging more at the resistance level and it is expected that the prices will break out eventually from the resistance level.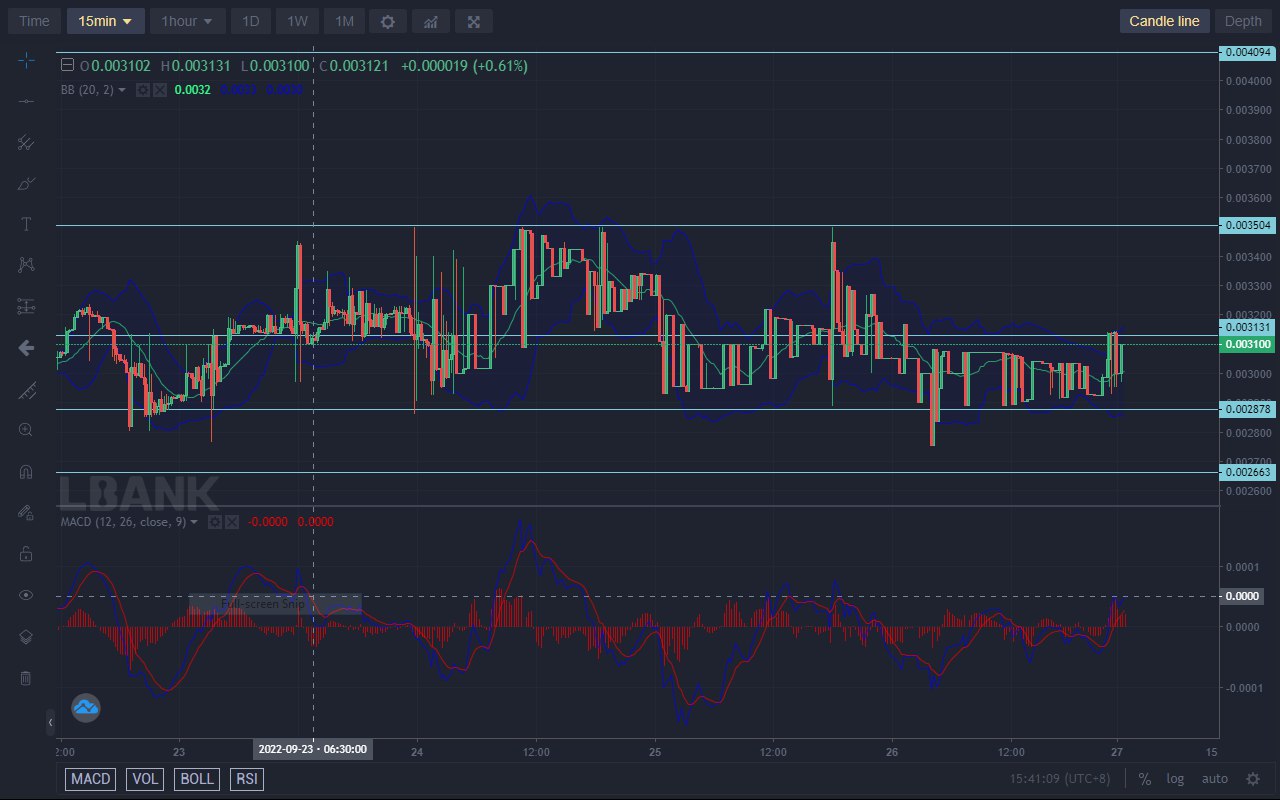
The latest move of the market has seen the MACD lines gradually move towards the zero level but with more bias to the upside. The bullish histogram bars stand out to show the current bullish orientation. The middle line of the Bollinger Band is acting as support for the 15-minute candlesticks. IBAT’s target is the $0.0040940 resistance level.
Battle Infinity has huge potential for unusually massive returns. Buy IBAT
Note: Cryptosignals.org is not a financial advisor. Do your research before investing your funds in any financial asset or presented product or event. We are not responsible for your investing results.