The Curve Market (CRV/USD) Skyrockets
Estimated Reading Time: 3 minutes
Don’t invest unless you’re prepared to lose all the money you invest. This is a high-risk investment and you are unlikely to be protected if something goes wrong. Take 2 minutes to learn more
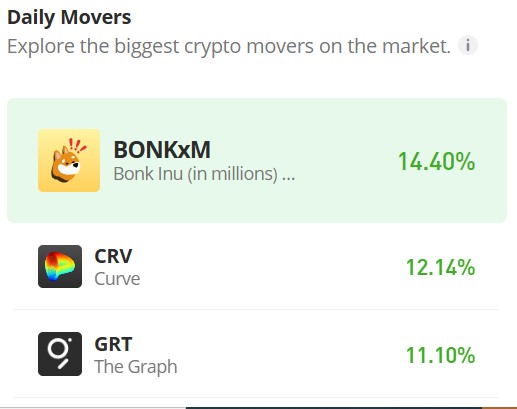
The Curve market (CRV) experienced a significant rally today, surging over 12%. Bullish momentum has persisted, even after yesterday’s peak at the $0.40 price level, where some traders took profits. Today, as the price dipped to around $0.37, buyers re-entered the market, driving the crypto signal above the previous resistance level of $0.40. The market is now extending its upward movement, targeting the $0.45 price level.
The Curve Market Data
- CRV/USD Price Now: $0.43
- CRV/USD Market Cap: $525.6 million
- CRV/USD Circulating Supply: 1.24 billion CRV
- CRV/USD Total Supply: 2.2 billion CRV
- CRV/USD CoinMarketCap Ranking: #133
Key Levels
- Resistance: $0.45, $0.50, and $0.55
- Support: $0.35, $0.30, and $0.25.
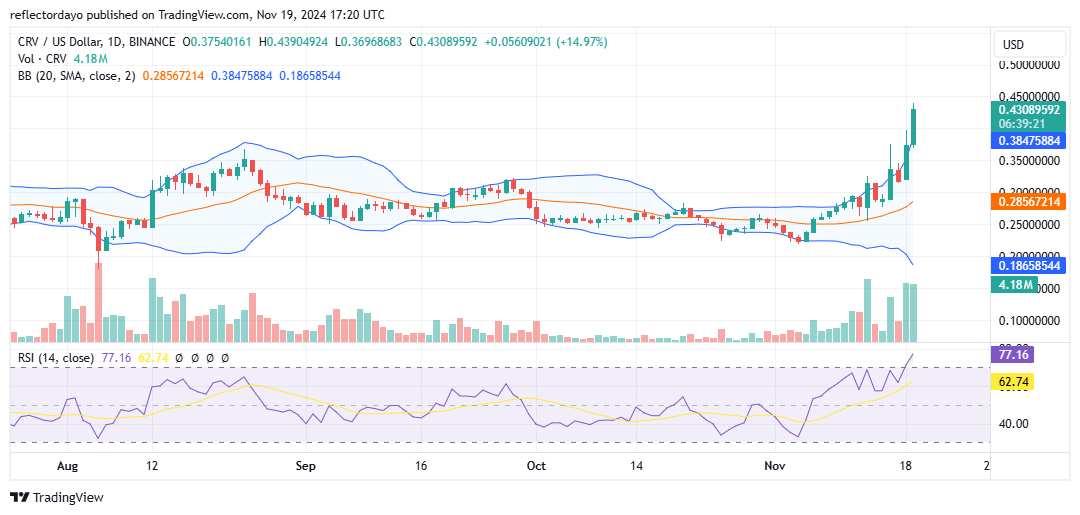
The Curve Market Through the Lens of Indicators
Curve (CRV) opened the trading day with strong bullish momentum, building on yesterday’s closing price of $0.37. The market easily breached the $0.40 resistance level, a point where many traders had previously taken profits. Currently, the market is encountering another resistance level near $0.45.
The long upper shadows on the past three candlesticks indicate profit-taking behavior by traders, contributing to increased market volatility. However, bullish sentiment remains dominant.
The RSI indicator is currently overbought, suggesting potential exhaustion of the uptrend. Additionally, the Bollinger Bands indicate overbought conditions as the price has moved significantly above the upper standard deviation.
Given these factors, traders should anticipate a potential price correction. A likely support level is $0.40. If the price fails to find support at $0.40 due to the current market volatility, the next significant support level to watch is $0.35.
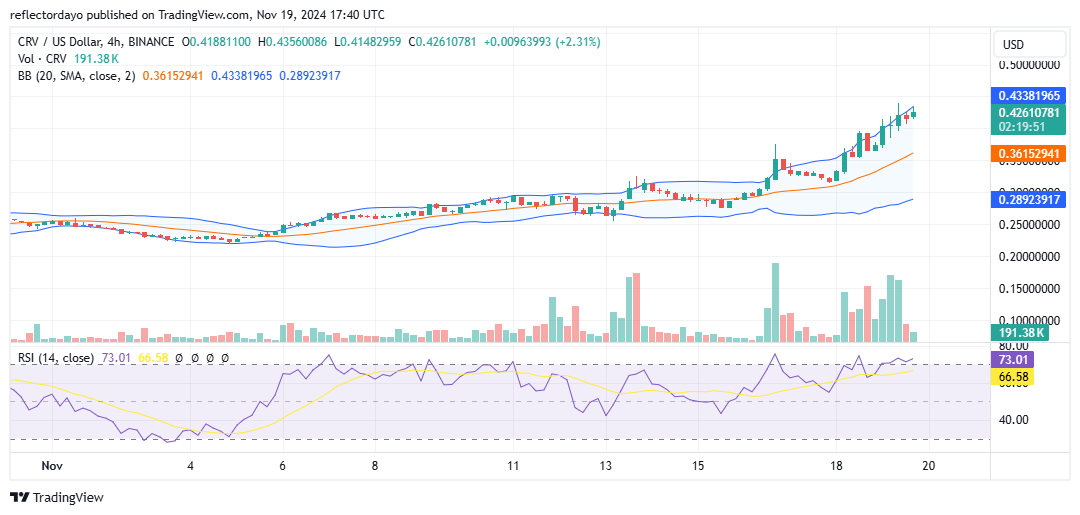
CRV/USD Price Prediction: 4-Hour Chart Analysis
Since November 5th, the Curve market has formed a series of higher lows, indicative of a potential uptrend. Recently, this bullish trend has accelerated, pushing the market above the $0.35 and $0.40 resistance levels.
However, after crossing the $0.40 level, the market has experienced a balance between buying and selling pressure. This has led to a slowdown in momentum and a significant decrease in trading volume.
Given the overbought condition of the market, as indicated by an RSI value above 70, traders should be prepared for a potential correction.